Python, MATLAB, Julia, R code: Chapter 7
Acknowledgement: The Julia code is written by the contributors listed here.
Acknowledgement: The R code is written by contributors listed here.
Chapter 7.1 Principles of Regression
Linear regression: Straight Line
# MATLAB code to fit data points using a straight line
N = 50;
x = rand(N,1)*1;
a = 2.5;                         % true parameter
b = 1.3;                         % true parameter
y = a*x + b + 0.2*rand(size(x)); % Synthesize training data

X    = [x(:) ones(N,1)];         % construct the X matrix
theta = X\y(:);                  % solve y = X theta

t    = linspace(0, 1, 200);      % interpolate and plot
yhat = theta(1)*t + theta(2);
plot(x,y,'o','LineWidth',2); hold on;
plot(t,yhat,'r','LineWidth',4);
# Python code to fit data points using a straight line
import numpy as np
import matplotlib.pyplot as plt

N = 50
x = np.random.rand(N)
a = 2.5                                 # true parameter
b = 1.3                                 # true parameter
y = a*x + b + 0.2*np.random.randn(N)    # Synthesize training data

X = np.column_stack((x, np.ones(N)))    # construct the X matrix
theta = np.linalg.lstsq(X, y, rcond=None)[0] # solve y = X theta

t = np.linspace(0,1,200)                # interpolate and plot
yhat = theta[0]*t + theta[1]
plt.plot(x,y,'o')
plt.plot(t,yhat,'r',linewidth=4)
# Julia code to fit data points using a straight line
N = 50
x = rand(N)
a = 2.5                         # true parameter
b = 1.3                         # true parameter
y = a*x .+ b + 0.2*rand(N)      # Synthesize training data

X = [x ones(N)]                 # construct the X matrix
theta = X\y                         # solve y = X*theta

t    = range(0,stop=1,length=200)
yhat = theta[1]*t .+ theta[2]                  # fitted values at t

p1 = scatter(x,y,makershape=:circle,label="data",legend=:topleft)
plot!(t,yhat,linecolor=:red,linewidth=4,label="best fit")
display(p1)
# R code to fit data points using a straight line

library(pracma)

N <- 50
x <- runif(N)

a <- 2.5 # true parameter
b <- 1.3 # true parameter
y <- a*x + b + 0.2*rnorm(N) # Synthesize training data

X <- cbind(x, rep(1, N))
theta <- lsfit(X, y)$coefficients
t <- linspace(0, 1, 200)
yhat <- theta[2]*t + theta[1]
plot(x, y, pch=19)
lines(t, yhat, col='red', lwd=4)
legend("bottomright", c("Best Fit", "Data"), fill=c("red", "black"))
Linear regression: Polynomial
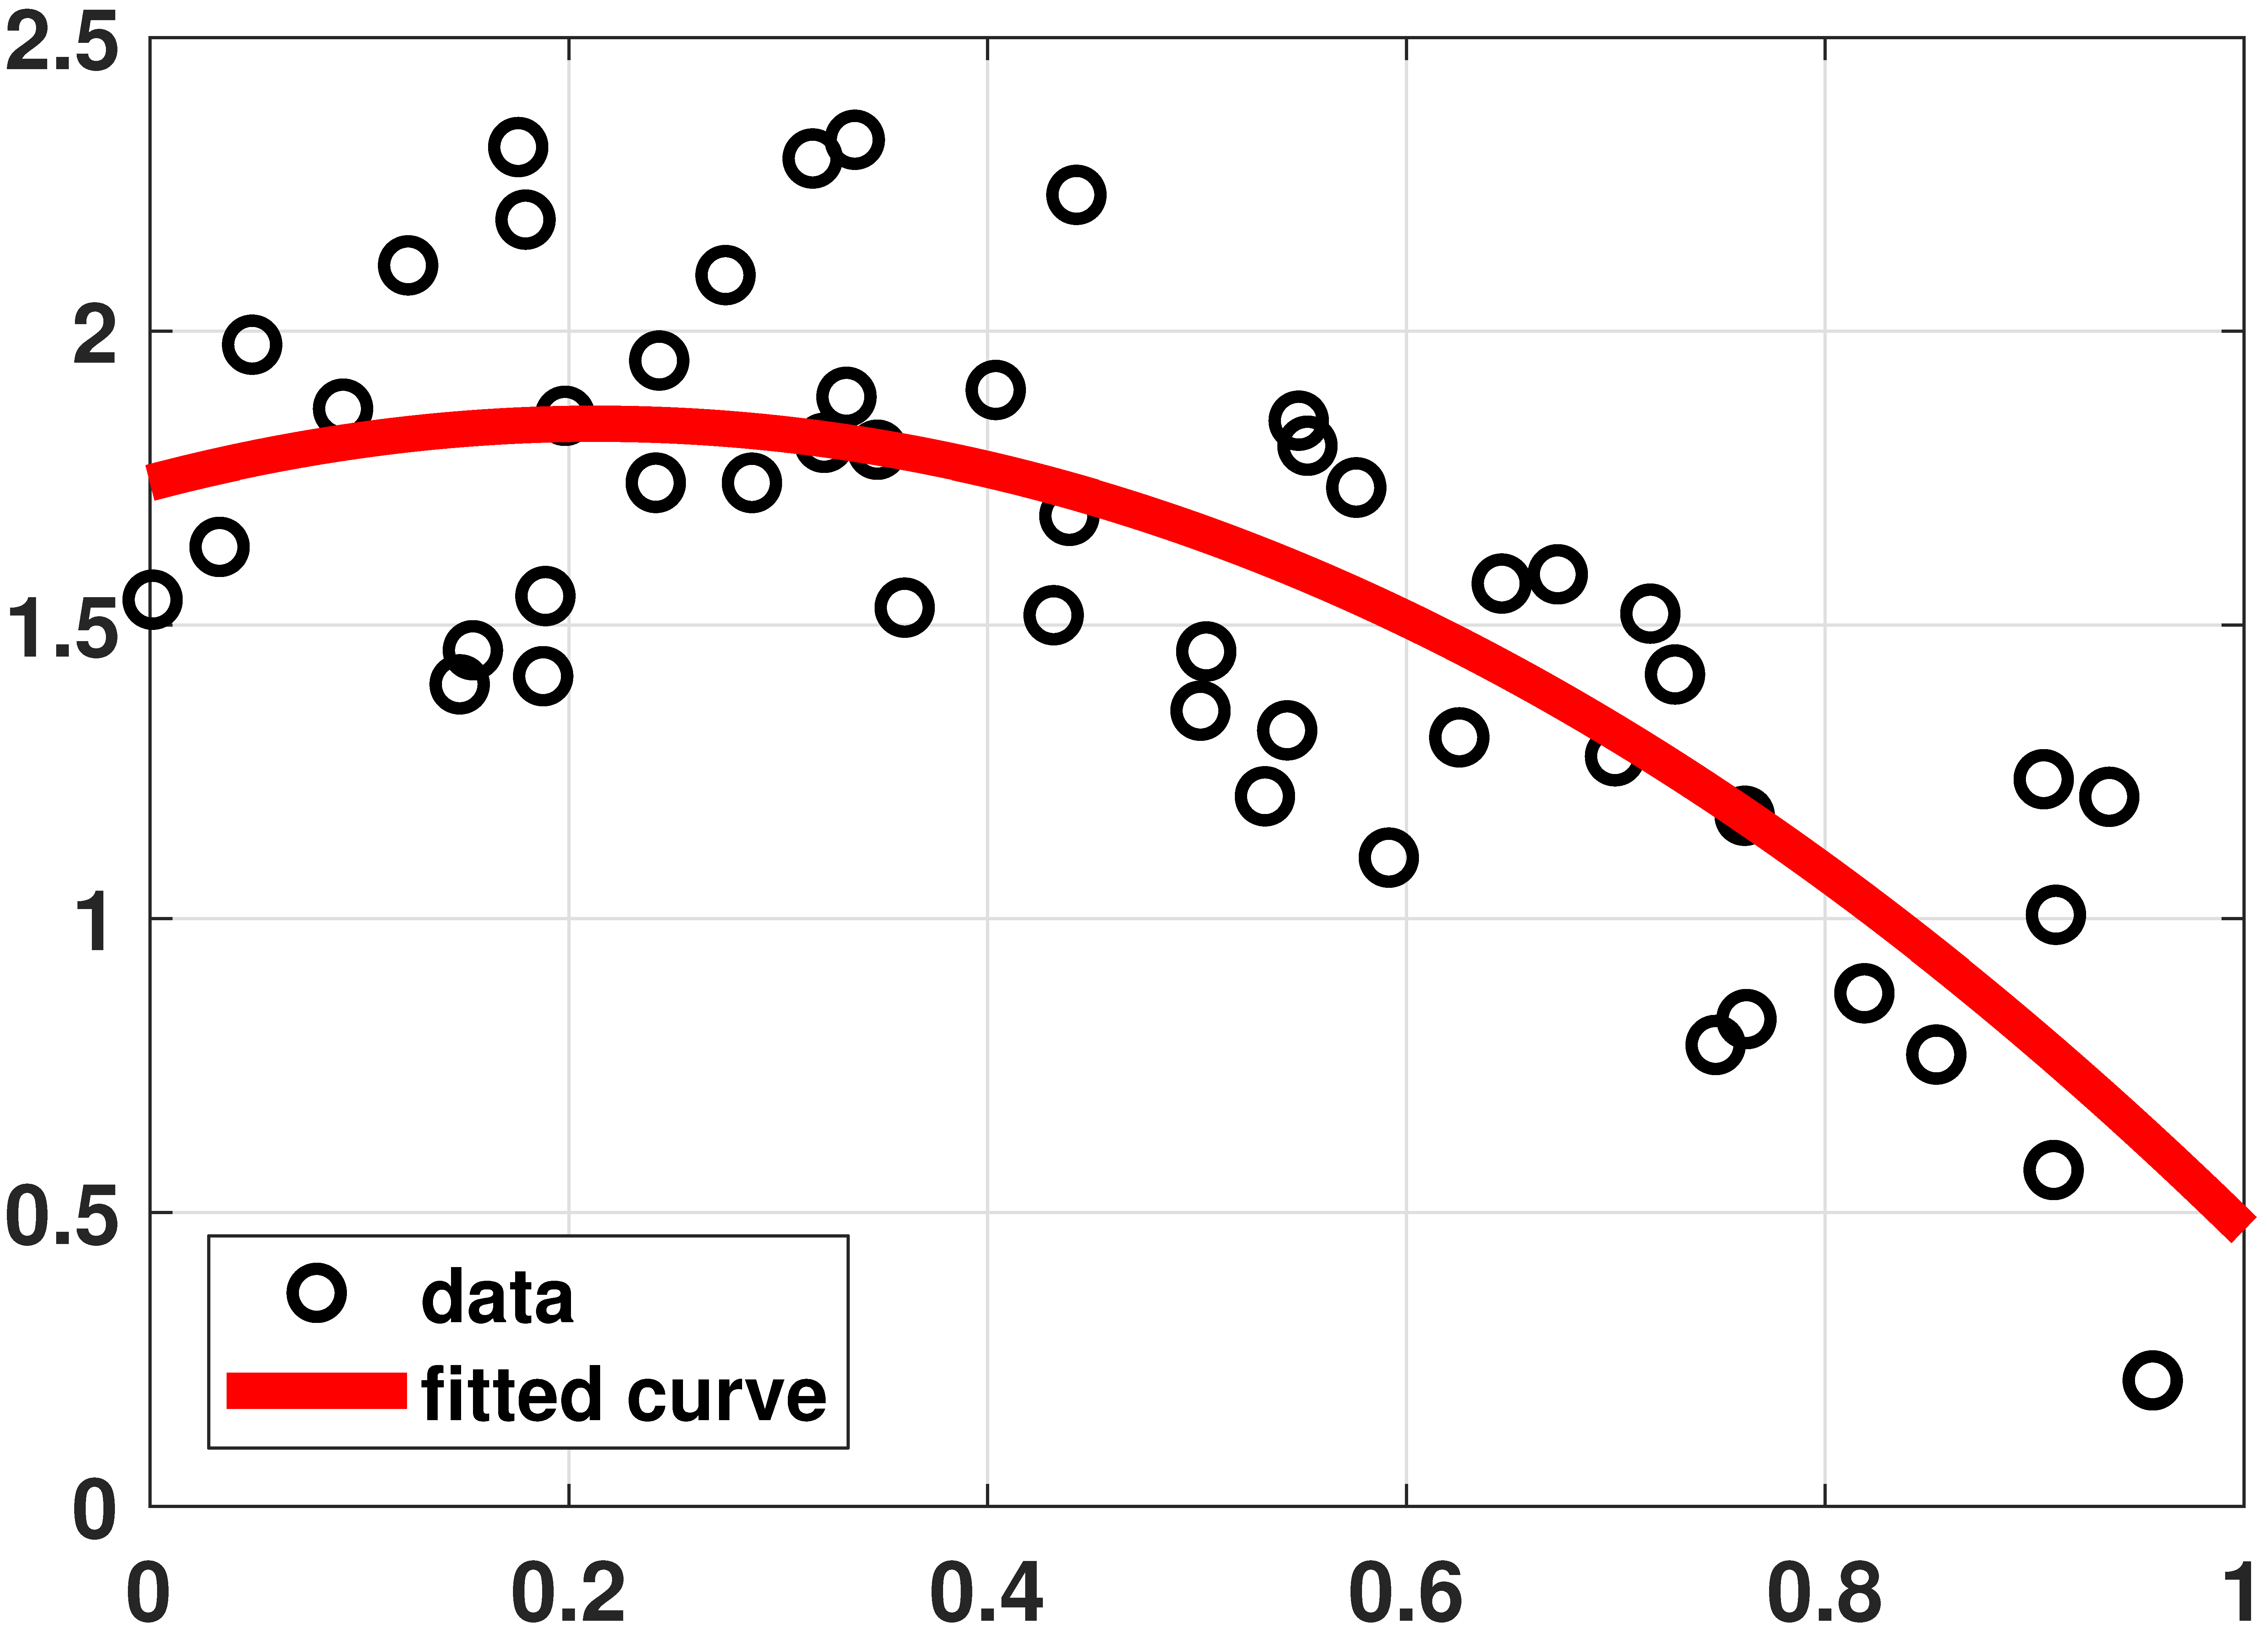
% MATLAB code to fit data using a quadratic equation
N = 50;
x = rand(N,1)*1;
a = -2.5;
b = 1.3;
c = 1.2;
y = a*x.^2 + b*x + c + 1*rand(size(x));

N    = length(x);
X    = [ones(N,1) x(:) x(:).^2];
beta = X\y(:);
t    = linspace(0, 1, 200);
yhat = theta(3)*t.^2 + theta(2)*t + theta(1);
plot(x,y,   'o','LineWidth',2); hold on;
plot(t,yhat,'r','LineWidth',6);
# Python code to fit data using a quadratic equation
import numpy as np
import matplotlib.pyplot as plt

N = 50
x = np.random.rand(N)
a = -2.5
b = 1.3
c = 1.2
y = a*x**2 + b*x + c + 0.2*np.random.randn(N)

X = np.column_stack((np.ones(N), x, x**2))
theta = np.linalg.lstsq(X, y, rcond=None)[0]
t = np.linspace(0,1,200)
yhat = theta[0] + theta[1]*t + theta[2]*t**2
plt.plot(x,y,'o')
plt.plot(t,yhat,'r',linewidth=4)
# Julia code to fit data using a quadratic equation
N = 50
x = rand(N)
a = -2.5
b = 1.3
c = 1.2
X = x.^[0 1 2]                #same as [ones(N) x x.^2]
y = X*[c,b,a] + rand(N)

theta    = X\y
t    = range(0,stop=1,length=200)
yhat = (t.^[0 1 2])*theta               #same as (t.^collect(0:2)')*theta

p2 = scatter(x,y,makershape=:circle,label="data",legend=:bottomleft)
plot!(t,yhat,linecolor=:red,linewidth=4,label="fitted curve")
display(p2)
# R code to fit data using a quadratic equation

N <- 50
x <- runif(N)
a <- -2.5
b <- 1.3
c <- 1.2
y <- a*x**2 + b*x + c + 0.2*rnorm(N)
X <- cbind(rep(1, N), x, x**2)
theta <- lsfit(X, y)$coefficients
t = linspace(0, 1, 200)
print(theta)
yhat = theta[1] + theta[2]*t + theta[3]*t**2
plot(x,y,pch=19)
lines(t,yhat,col='red',lwd=4)
Legendre Polynomial
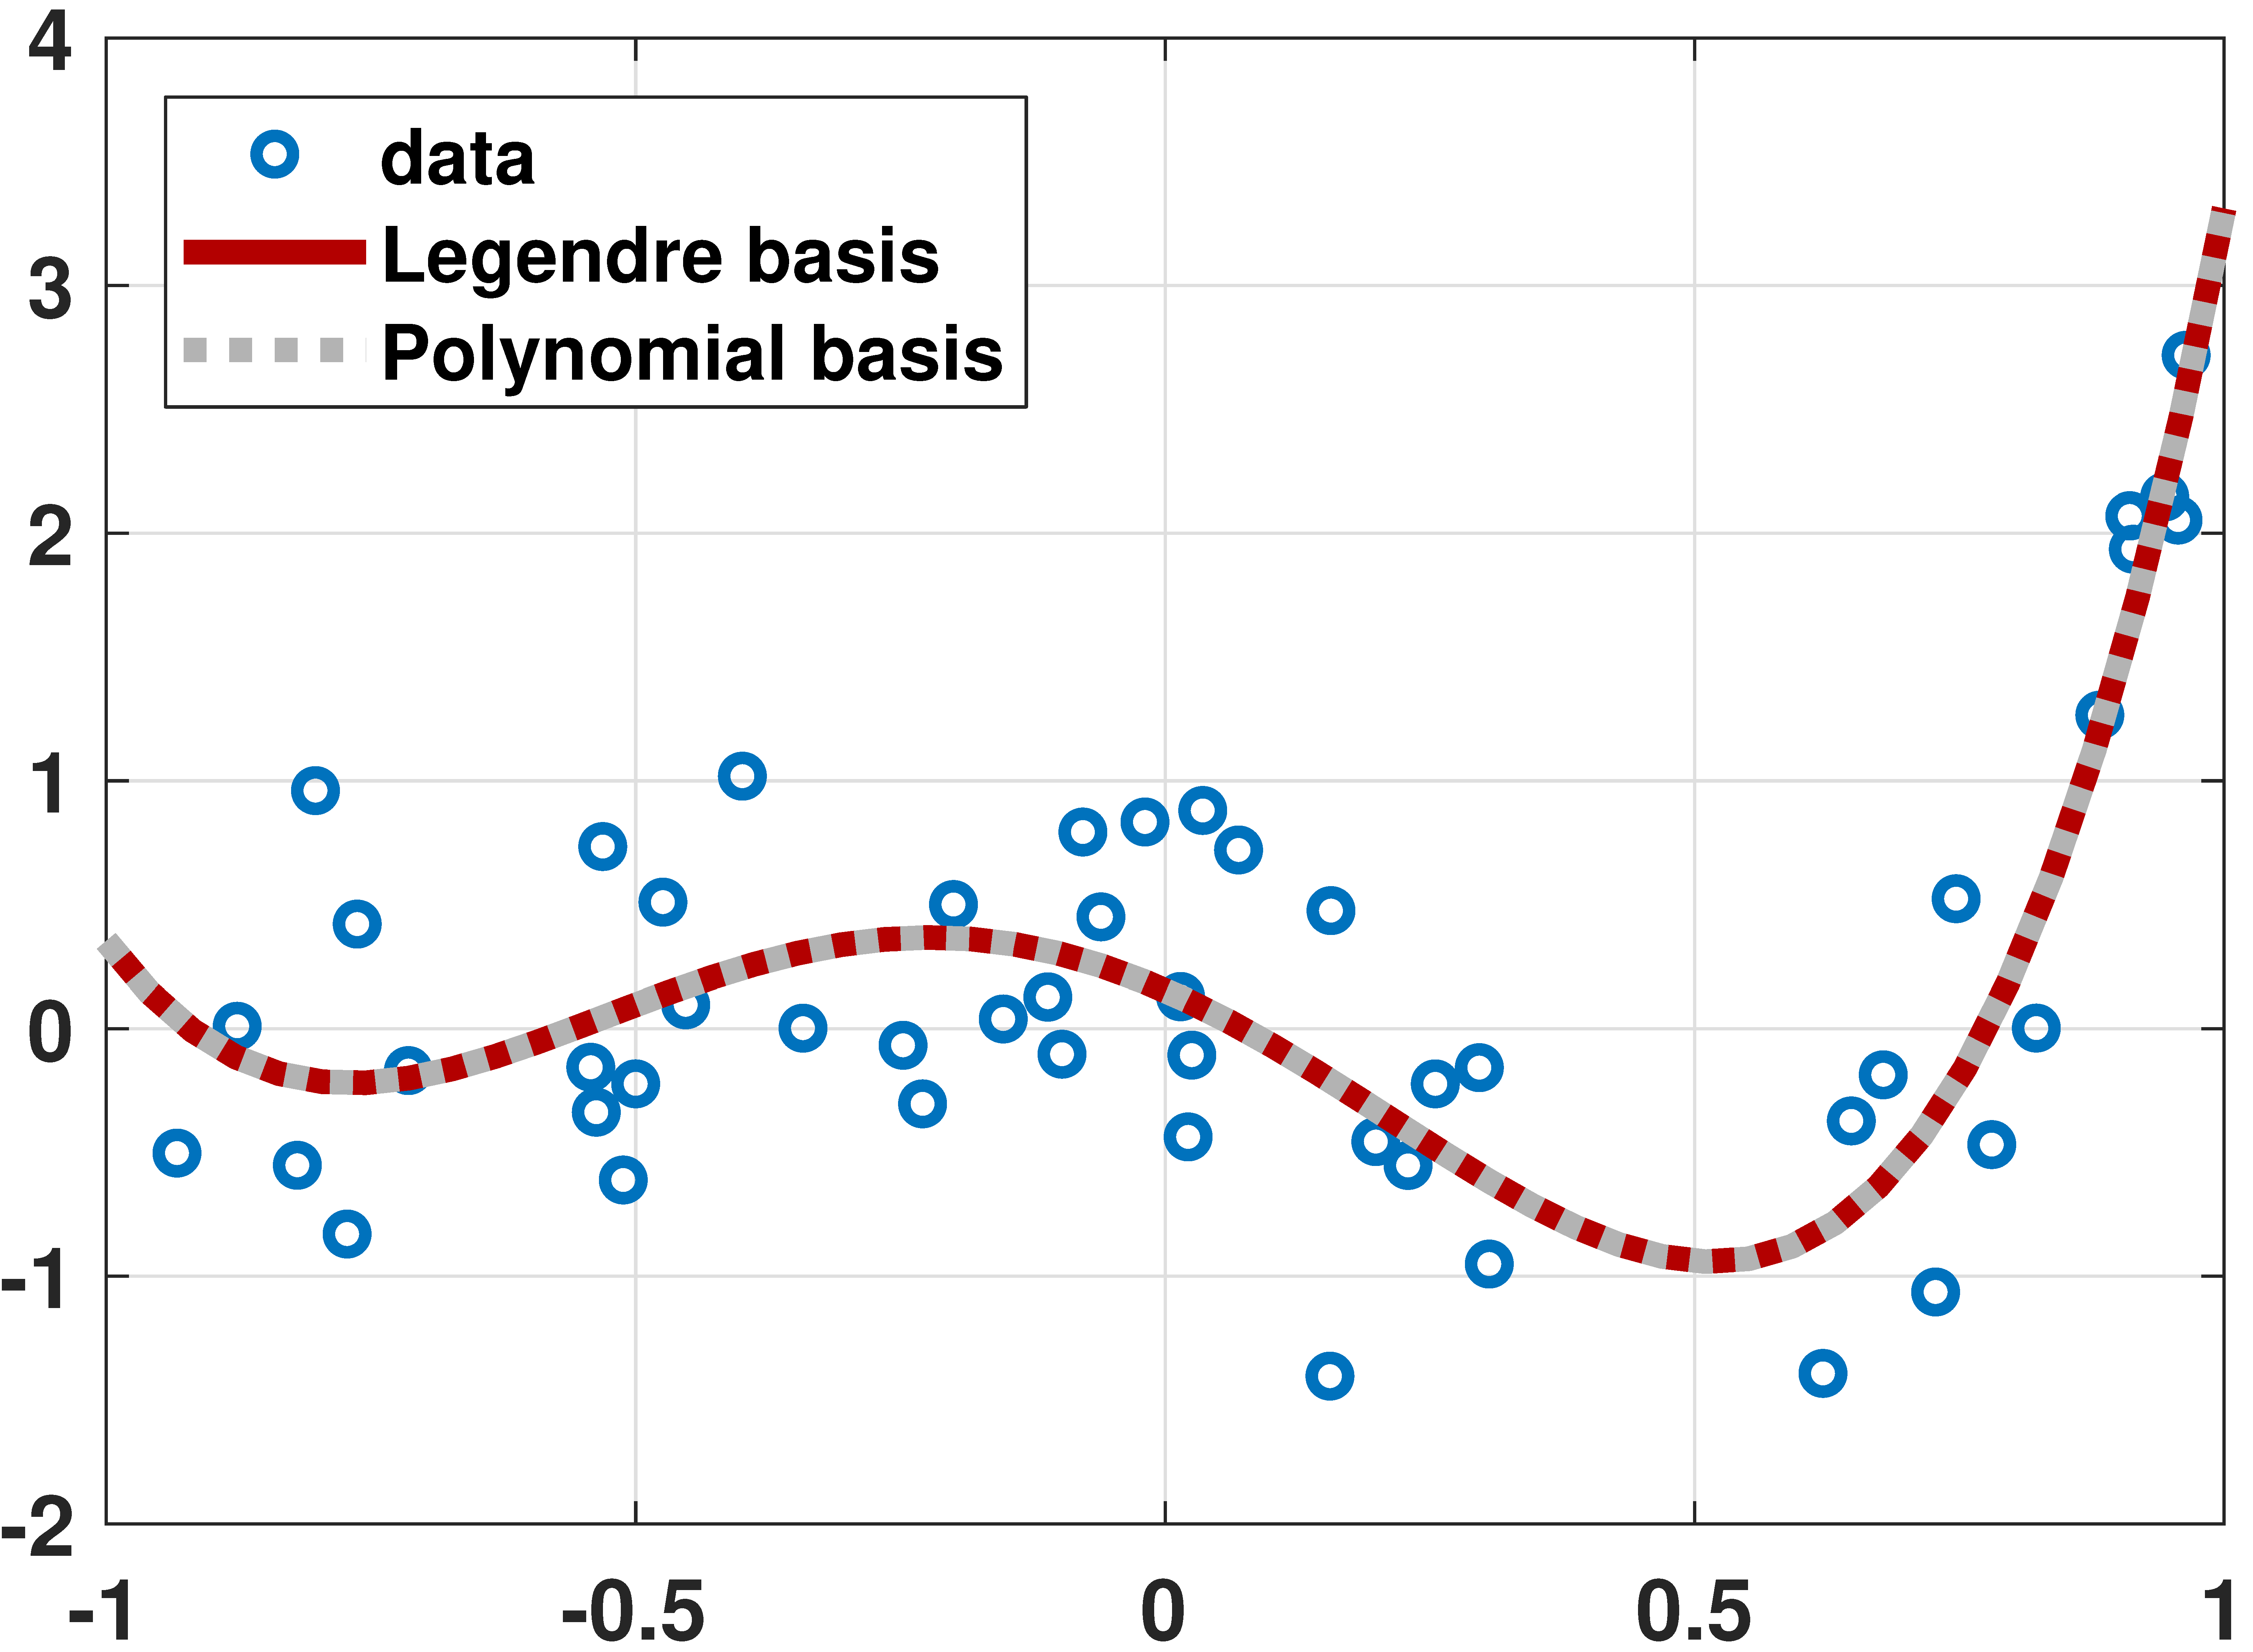
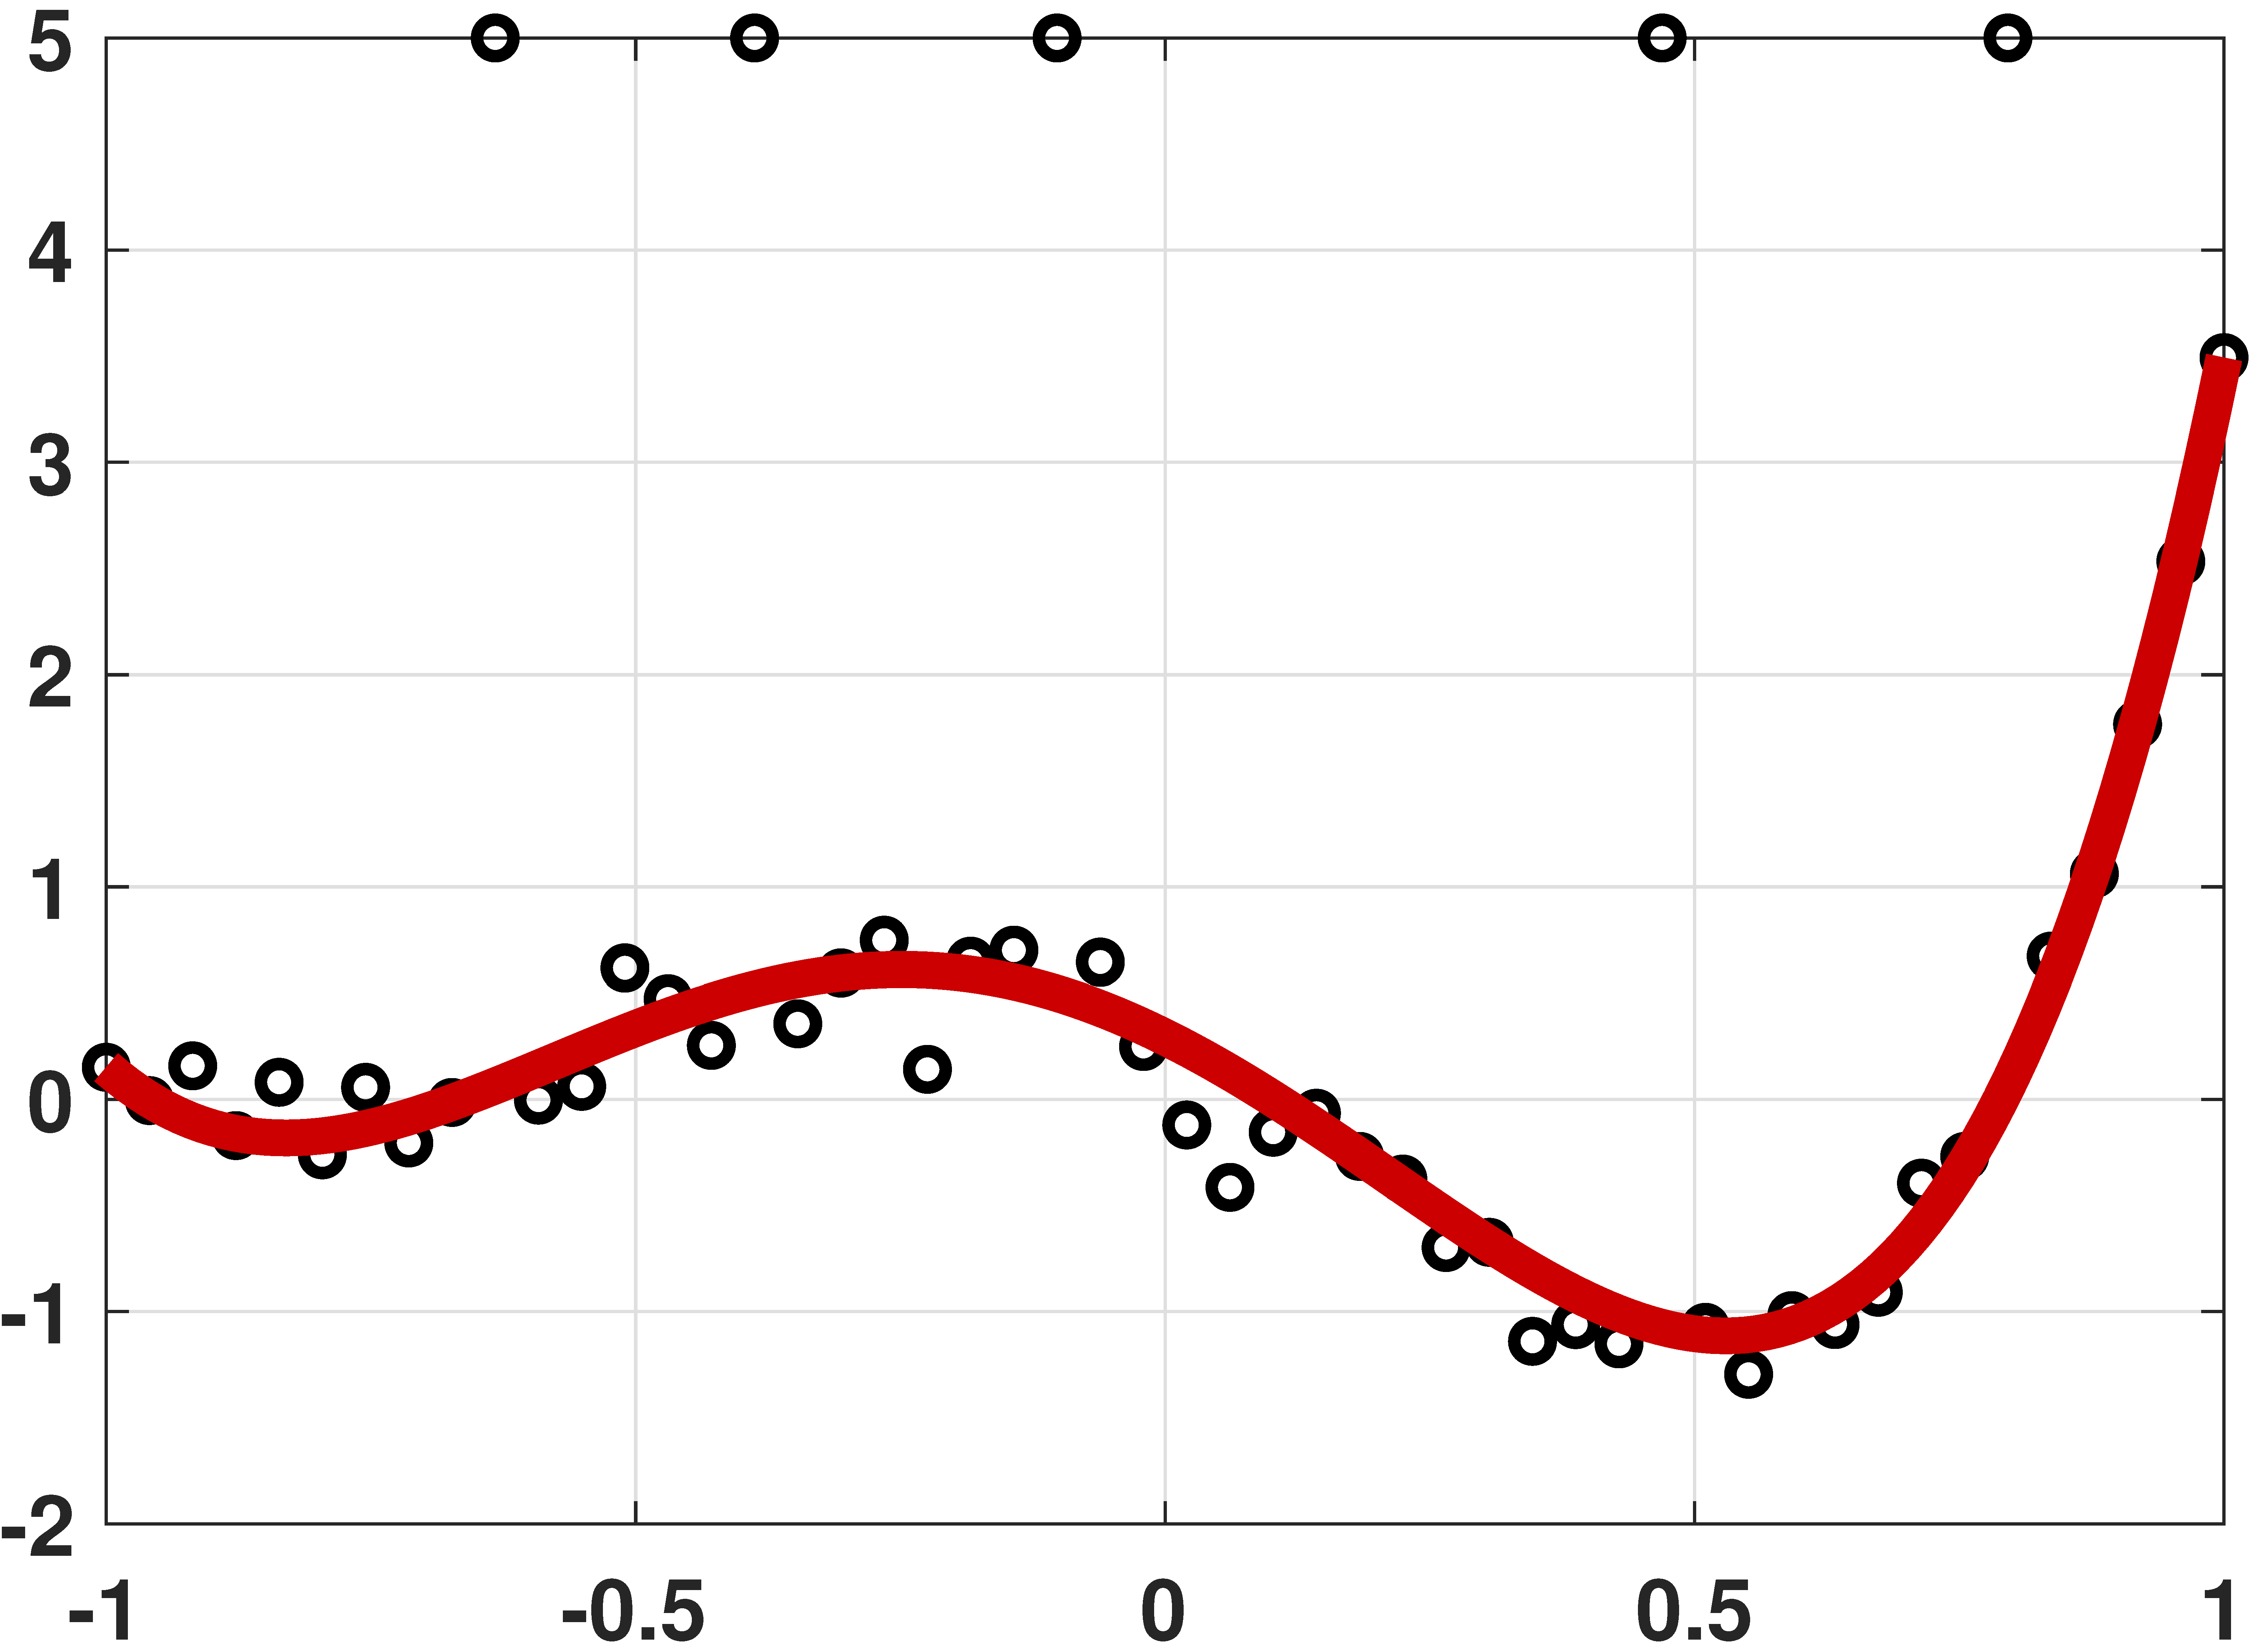
% MATLAB code to fit data using Legendre polynomials
N = 50;
x = 1*(rand(N,1)*2-1);
a = [-0.001 0.01 +0.55 1.5 1.2];
y = a(1)*legendreP(0,x) + a(2)*legendreP(1,x) + ...
  + a(3)*legendreP(2,x) + a(4)*legendreP(3,x) + ...
  + a(5)*legendreP(4,x) + 0.5*randn(N,1);

X = [legendreP(0,x(:)) legendreP(1,x(:)) ...
     legendreP(2,x(:)) legendreP(3,x(:)) ...
     legendreP(4,x(:))];
beta = X\y(:);

t    = linspace(-1, 1, 200);
yhat = beta(1)*legendreP(0,t) + beta(2)*legendreP(1,t) + ...
     + beta(3)*legendreP(2,t) + beta(4)*legendreP(3,t) + ...
     + beta(5)*legendreP(4,t);
plot(x,y,'ko','LineWidth',2,'MarkerSize',10); hold on;
plot(t,yhat,'LineWidth',6,'Color',[0.9 0 0]);
import numpy as np
import matplotlib.pyplot as plt
from scipy.special import eval_legendre

N = 50
x = np.linspace(-1,1,N)
a = np.array([-0.001, 0.01, 0.55, 1.5, 1.2])
y = a[0]*eval_legendre(0,x) + a[1]*eval_legendre(1,x) + \
    a[2]*eval_legendre(2,x) + a[3]*eval_legendre(3,x) + \
    a[4]*eval_legendre(4,x) + 0.2*np.random.randn(N)

X = np.column_stack((eval_legendre(0,x), eval_legendre(1,x), \
                     eval_legendre(2,x), eval_legendre(3,x), \
                     eval_legendre(4,x)))
theta = np.linalg.lstsq(X, y, rcond=None)[0]
t     = np.linspace(-1, 1, 50);
yhat  = theta[0]*eval_legendre(0,t) + theta[1]*eval_legendre(1,t) + \
        theta[2]*eval_legendre(2,t) + theta[3]*eval_legendre(3,t) + \
        theta[4]*eval_legendre(4,t)
plt.plot(x,y,'o',markersize=12)
plt.plot(t,yhat, linewidth=8)
plt.show()
# Julia code to fit data using Legendre polynomials

using LegendrePolynomials

N = 50
x = rand(N)*2 .- 1
a = [-0.001, 0.01, 0.55, 1.5, 1.2]
X = hcat([Pl.(x,p) for p=0:4]...)   # same as [Pl.(x,0) Pl.(x,1) Pl.(x,2) Pl.(x,3) Pl.(x,4)]
y = X*a + 0.5*randn(N)
theta = X\y

t    = range(-1,stop=1,length=200)
yhat = hcat([Pl.(t,p) for p=0:4]...)*theta

p3 = scatter(x,y,makershape=:circle,label="data",legend=:bottomleft)
plot!(t,yhat,linecolor=:red,linewidth=4,label="fitted curve")
display(p3)
# R code to fit data using Legendre polynomials

library(pracma)

N <- 50
x <- linspace(-1,1,N)
a <- c(-0.001, 0.01, 0.55, 1.5, 1.2)
y <- a[1]*legendre(0, x) + a[2]*legendre(1, x)[1,] +
  a[3]*legendre(2, x)[1,] + a[4]*legendre(3, x)[1,] +
  a[5]*legendre(4, x)[1,] + 0.2*rnorm(N)

X <- cbind(legendre(0, x), legendre(1, x)[1,],
           legendre(2, x)[1,], legendre(3, x)[1,],
           legendre(4, x)[1,]) # good

beta <- mldivide(X, y)

t <- linspace(-1, 1, 50)
yhat <- beta[1]*legendre(0, x) + beta[2]*legendre(1, x)[1,] +
  beta[3]*legendre(2, x)[1,] + beta[4]*legendre(3, x)[1,] +
  beta[5]*legendre(4, x)[1,]

plot(x, y, pch=19, col="blue")
lines(t, yhat, lwd=2, col="orange")
Auto-regressive model
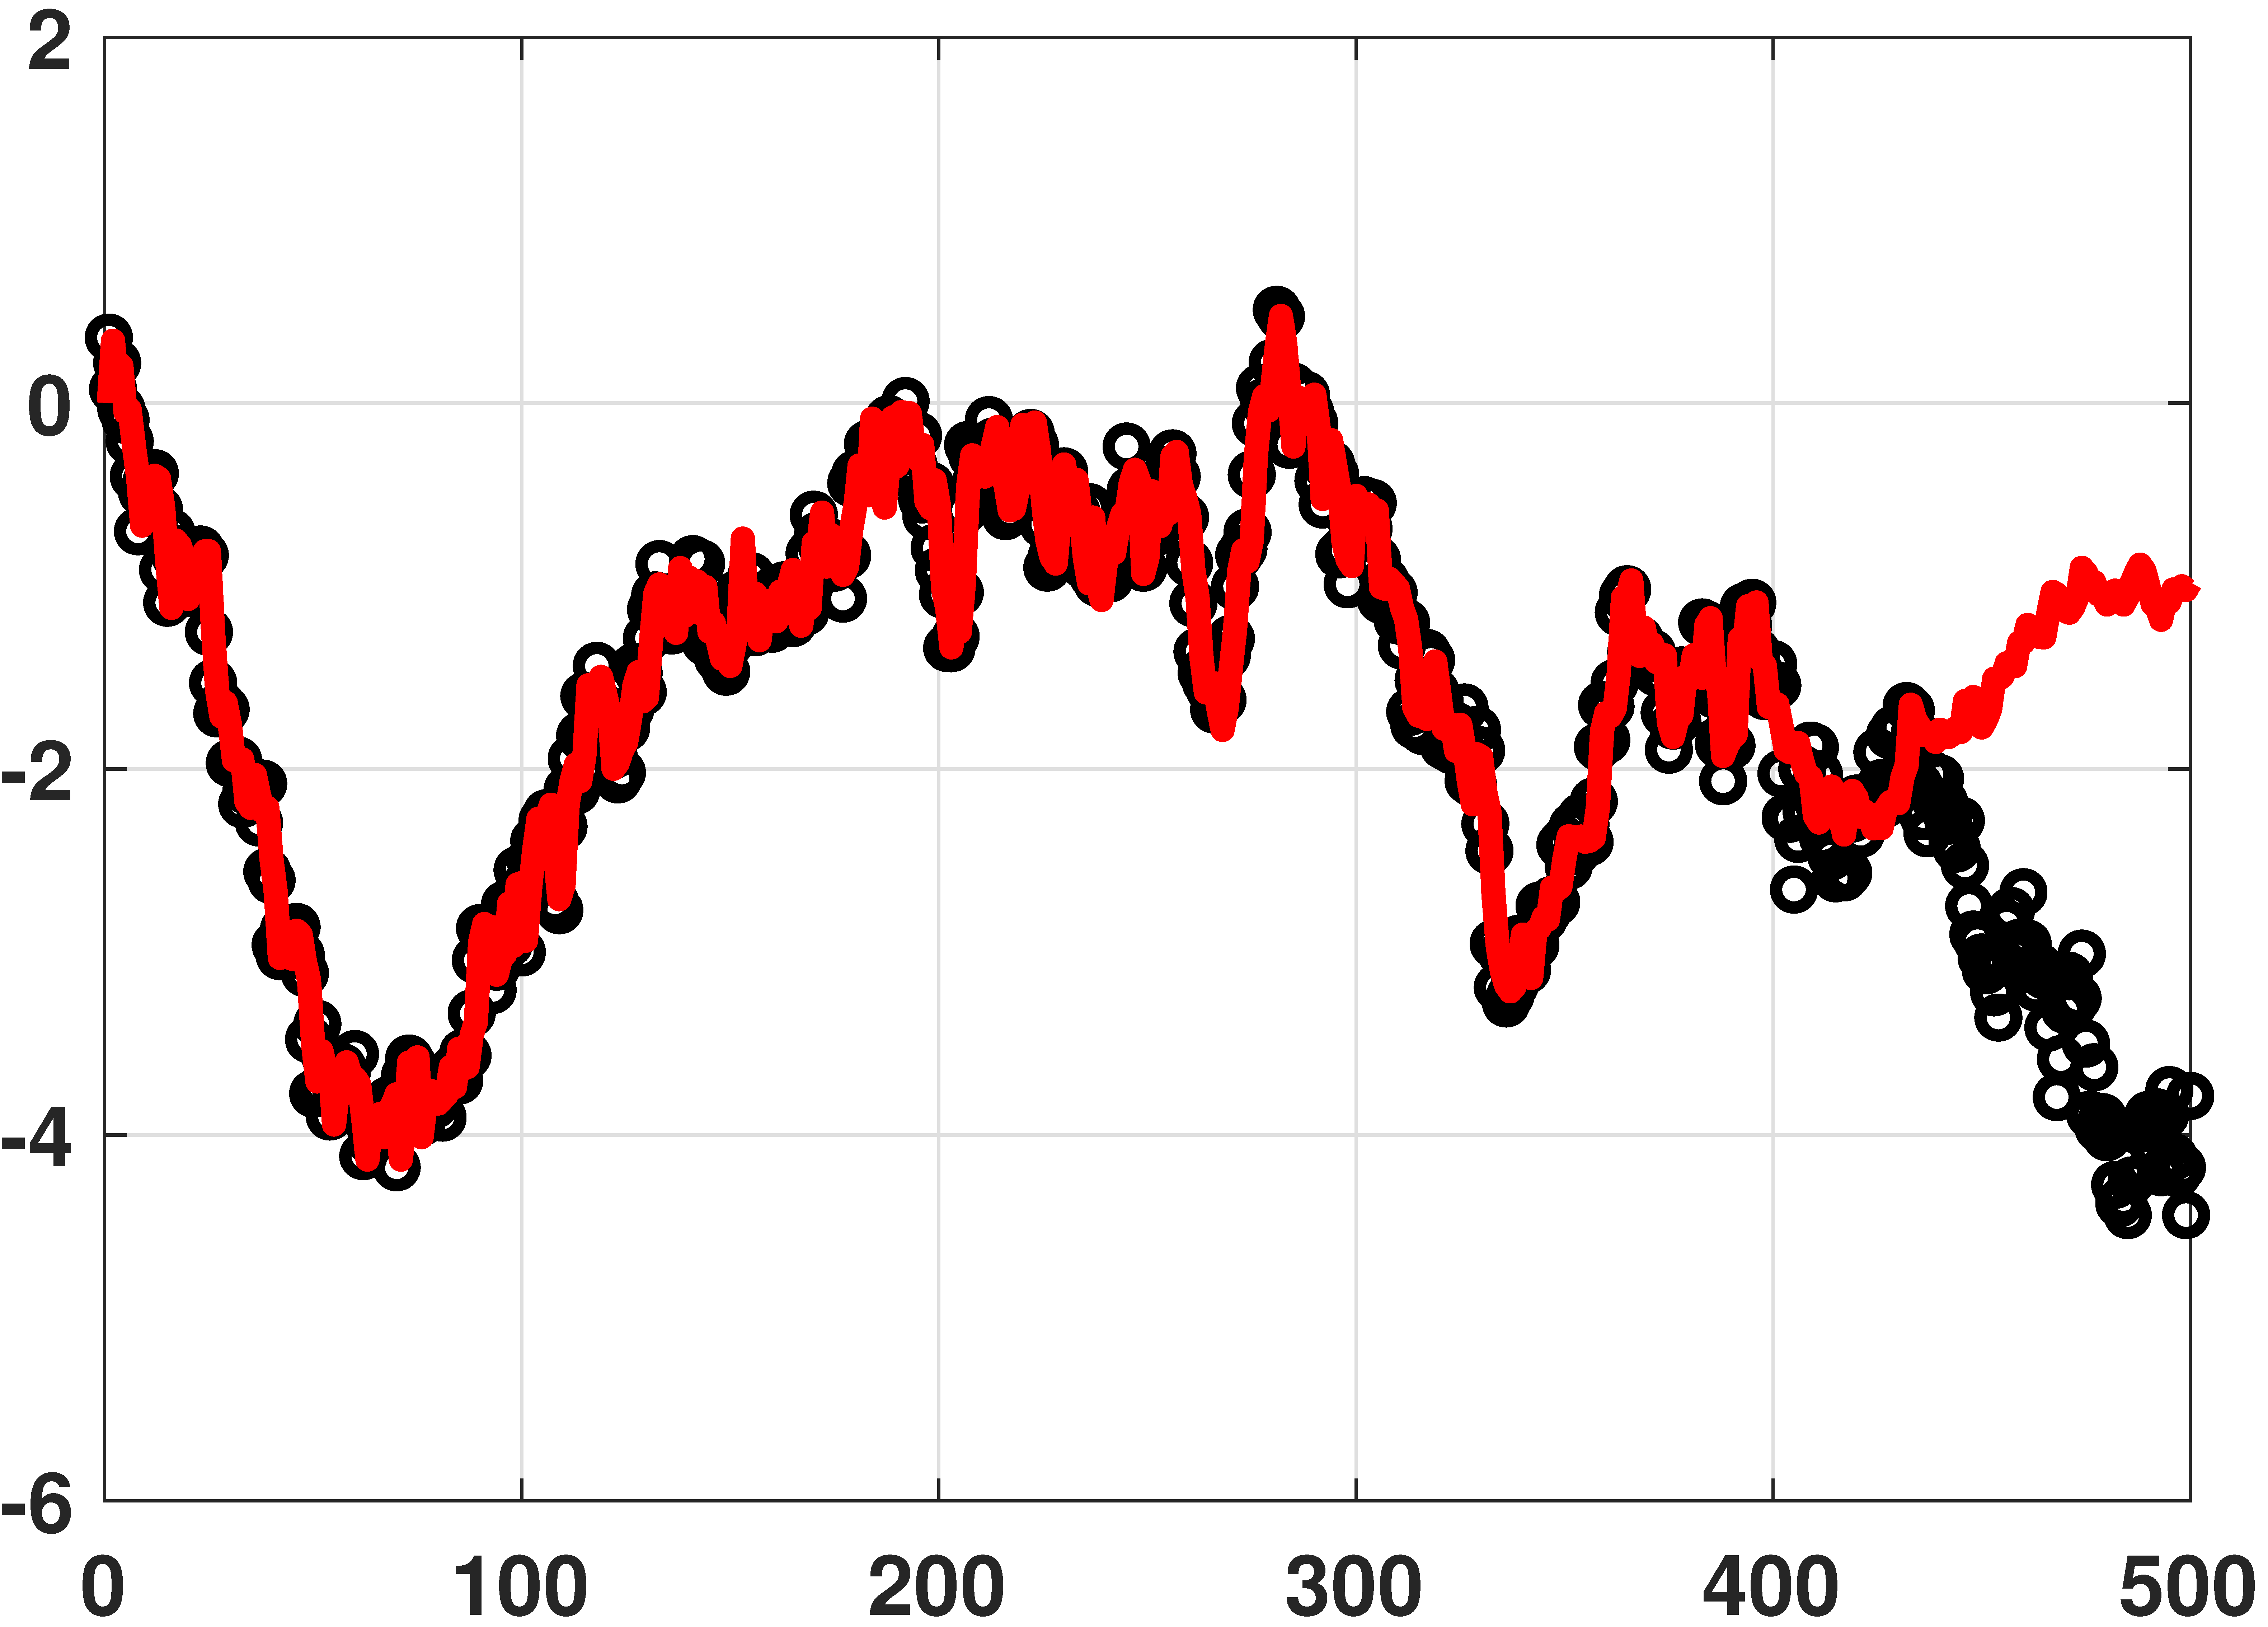
% MATLAB code for auto-regressive model
N = 500;
y = cumsum(0.2*randn(N,1)) + 0.05*randn(N,1);   % generate data

L = 100;                                        % use previous 100 samples
c = [0; y(1:400-1)];
r = zeros(1,L);
X = toeplitz(c,r);                              % Toeplitz matrix
theta = X\y(1:400);                             % solve y = X theta
yhat = X*theta;                                 % prediction
plot(y(1:400),   'ko','LineWidth',2);hold on;
plot(yhat(1:400),'r','LineWidth',4);
# Python code for auto-regressive model
import numpy as np
import matplotlib.pyplot as plt
from scipy.linalg import toeplitz

N = 500
y = np.cumsum(0.2*np.random.randn(N)) + 0.05*np.random.randn(N)

L = 100
c = np.hstack((0, y[0:400-1]))
r = np.zeros(L)
X = toeplitz(c,r)
theta = np.linalg.lstsq(X, y[0:400], rcond=None)[0]
yhat  = np.dot(X, theta)
plt.plot(y[0:400], 'o')
plt.plot(yhat[0:400],linewidth=4)
# Julia code for auto-regressive model
using ToeplitzMatrices

N = 500
y = cumsum(0.2*randn(N)) + 0.05*randn(N)        # generate data

L = 100                                         # use previous 100 samples
c = [0; y[1:400-1]]
r = zeros(L)
X = Matrix(Toeplitz(c,r))                       # Toeplitz matrix, converted
theta = X\y[1:400]                                  # solve y = X*theta
yhat = X*theta                                      # prediction

p4 = scatter(y[1:400],makershape=:circle,label="data",legend=:bottomleft)
plot!(yhat[1:400],linecolor=:red,linewidth=4,label="fitted curve")
display(p4)
# R code for auto-regressive model

library(pracma)

N <- 500
y <- cumsum(0.2*rnorm(N)) + 0.05*rnorm(N)

L <- 100
c <- c(0, y[0:(400-1)])
r = rep(0, L)
X = Toeplitz(c,r)
beta <- mldivide(X, y[1:400])
yhat  = X %*% beta
plot(y[1:400])
lines(yhat[1:400], col="red")
Robust regression by linear programming
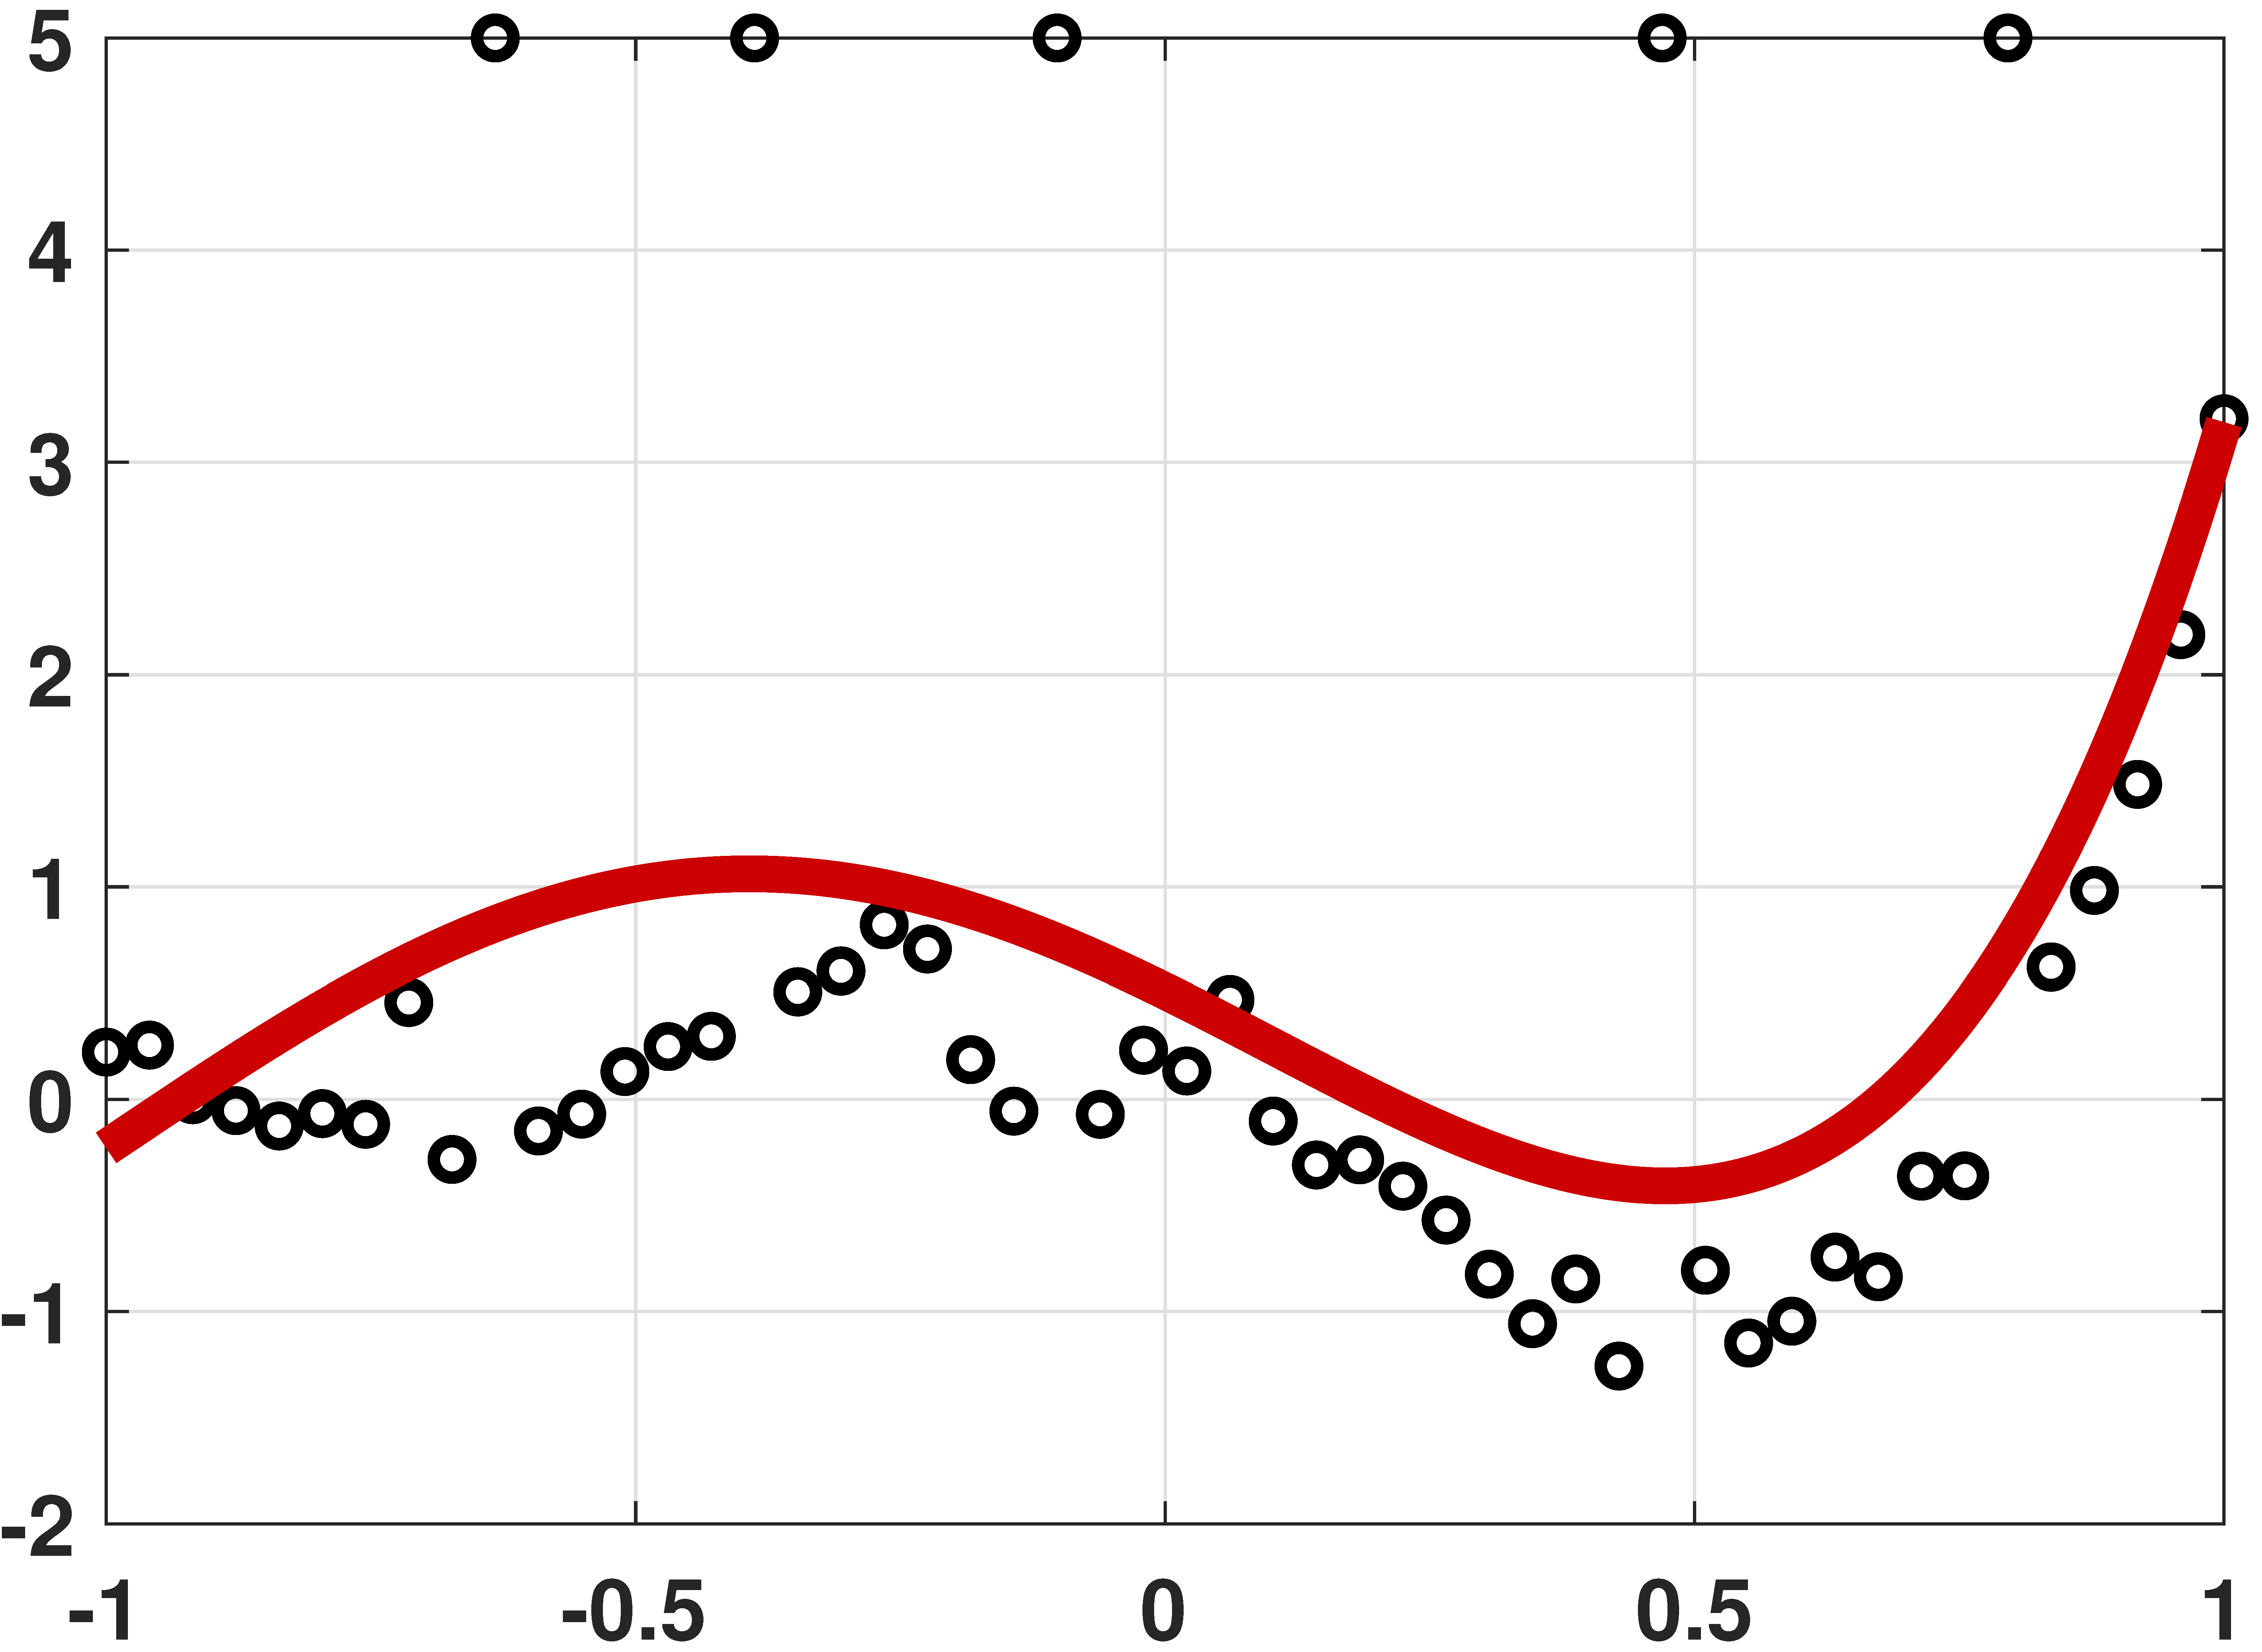
% MATLAB code to demonstrate robust regression
N = 50;
x = linspace(-1,1,N)';
a = [-0.001 0.01 0.55 1.5 1.2];
y = a(1)*legendreP(0,x) + a(2)*legendreP(1,x) + ...
    a(3)*legendreP(2,x) + a(4)*legendreP(3,x) + ...
    a(5)*legendreP(4,x) + 0.2*randn(N,1);
idx  = [10, 16, 23, 37, 45];
y(idx) = 5;

X    = [x(:).^0 x(:).^1 x(:).^2 x(:).^3 x(:).^4];
A    = [X -eye(N); -X -eye(N)];
b    = [y(:); -y(:)];
c    = [zeros(1,5) ones(1,N)]';
theta = linprog(c, A, b);

t    = linspace(-1,1,200)';
yhat = theta(1) + theta(2)*t(:) + ...
       theta(3)*t(:).^2 + theta(4)*t(:).^3 + ...
       theta(5)*t(:).^4;
plot(x,y,   'ko','LineWidth',2); hold on;
plot(t,yhat,'r','LineWidth',4);
# Python code to demonstrate robust regression
import numpy as np
import matplotlib.pyplot as plt
from scipy.special import eval_legendre
from scipy.optimize import linprog

N = 50
x = np.linspace(-1,1,N)
a = np.array([-0.001, 0.01, 0.55, 1.5, 1.2])
y = a[0]*eval_legendre(0,x) + a[1]*eval_legendre(1,x) + \
    a[2]*eval_legendre(2,x) + a[3]*eval_legendre(3,x) + \
    a[4]*eval_legendre(4,x) + 0.2*np.random.randn(N)
idx = [10,16,23,37,45]
y[idx] = 5
X = np.column_stack((np.ones(N), x, x**2, x**3, x**4))
A = np.vstack((np.hstack((X, -np.eye(N))), np.hstack((-X, -np.eye(N)))))
b = np.hstack((y,-y))
c = np.hstack((np.zeros(5), np.ones(N)))
res = linprog(c, A, b, bounds=(None,None), method="revised simplex")
theta = res.x
t    = np.linspace(-1,1,200)
yhat = theta[0]*np.ones(200) + theta[1]*t + theta[2]*t**2 + \
       theta[3]*t**3 + theta[4]*t**4
plt.plot(x,y,'o',markersize=12)
plt.plot(t,yhat, linewidth=8)
plt.show()
# Julia code to demonstrate robust regression

using LinearAlgebra, LegendrePolynomials, Convex, SCS
import MathOptInterface
const MOI = MathOptInterface

#----------------------------------------------------------
"""
    linprog_Convex(c,A,sense,b)
A wrapper for doing linear programming with Convex.jl/SCS.jl.
It solves, for instance, `c'x` st. `A*x<=b`
"""
function linprog_Convex(c,A,sense,b)
    n  = length(c)
    x  = Variable(n)
    #c1 = sense(A*x,b)             #restriction, for Ax <= b, use sense = (<=)
    c1 = A*x <= b
    prob = minimize(dot(c,x),c1)
    solve!(prob,()->SCS.Optimizer(verbose = false))
    x_i = prob.status == MOI.OPTIMAL ? vec(evaluate(x)) : NaN
    return x_i
end
#----------------------------------------------------------

N = 50
x = range(-1,stop=1,length=N)
a = [-0.001, 0.01, 0.55, 1.5, 1.2]
y = hcat([Pl.(x,p) for p=0:4]...)*a  + 0.05*randn(N)        # generate data
idx     = [10, 16, 23, 37, 45]
y[idx] .= 5

X = x.^[0 1 2 3 4]
A = [X -I; -X -I]
b = [y; -y]
c = [zeros(5);ones(N)]

theta = linprog_Convex(c,A,(<=),b)

t    = range(-1,stop=1,length=200)
yhat = (t.^[0 1 2 3 4])*theta[1:5]

p5 = scatter(x,y,makershape=:circle,label="data",legend=:bottomleft)
plot!(t,yhat,linecolor=:red,linewidth=4,label="fitted curve")
display(p5)
# R code to demonstrate robust regression
library(pracma)

N <- 50
x <- linspace(-1,1,N)
a <- c(-0.001, 0.01, 0.55, 1.5, 1.2)
y <- a[1]*legendre(0, x) + a[2]*legendre(1, x)[1,] +
  a[3]*legendre(2, x)[1,] + a[4]*legendre(3, x)[1,] +
  a[5]*legendre(4, x)[1,] + 0.2*rnorm(N)

idx <- c(10, 16, 23, 37, 45)
y[idx] <- 5

X <- cbind(rep(1,N), x, x**2, x**3, x**4)
A <- rbind(cbind(X, -1*diag(N)), cbind(-X, -1*diag(N)))
b <- c(y, -y)
c <- c(rep(0, 5), rep(1, N))
res <- linprog(c, A, b, maxiter=1000000)
beta <- res.x
t <- linspace(-1, 1, 200)
Chapter 7.2 Overfitting
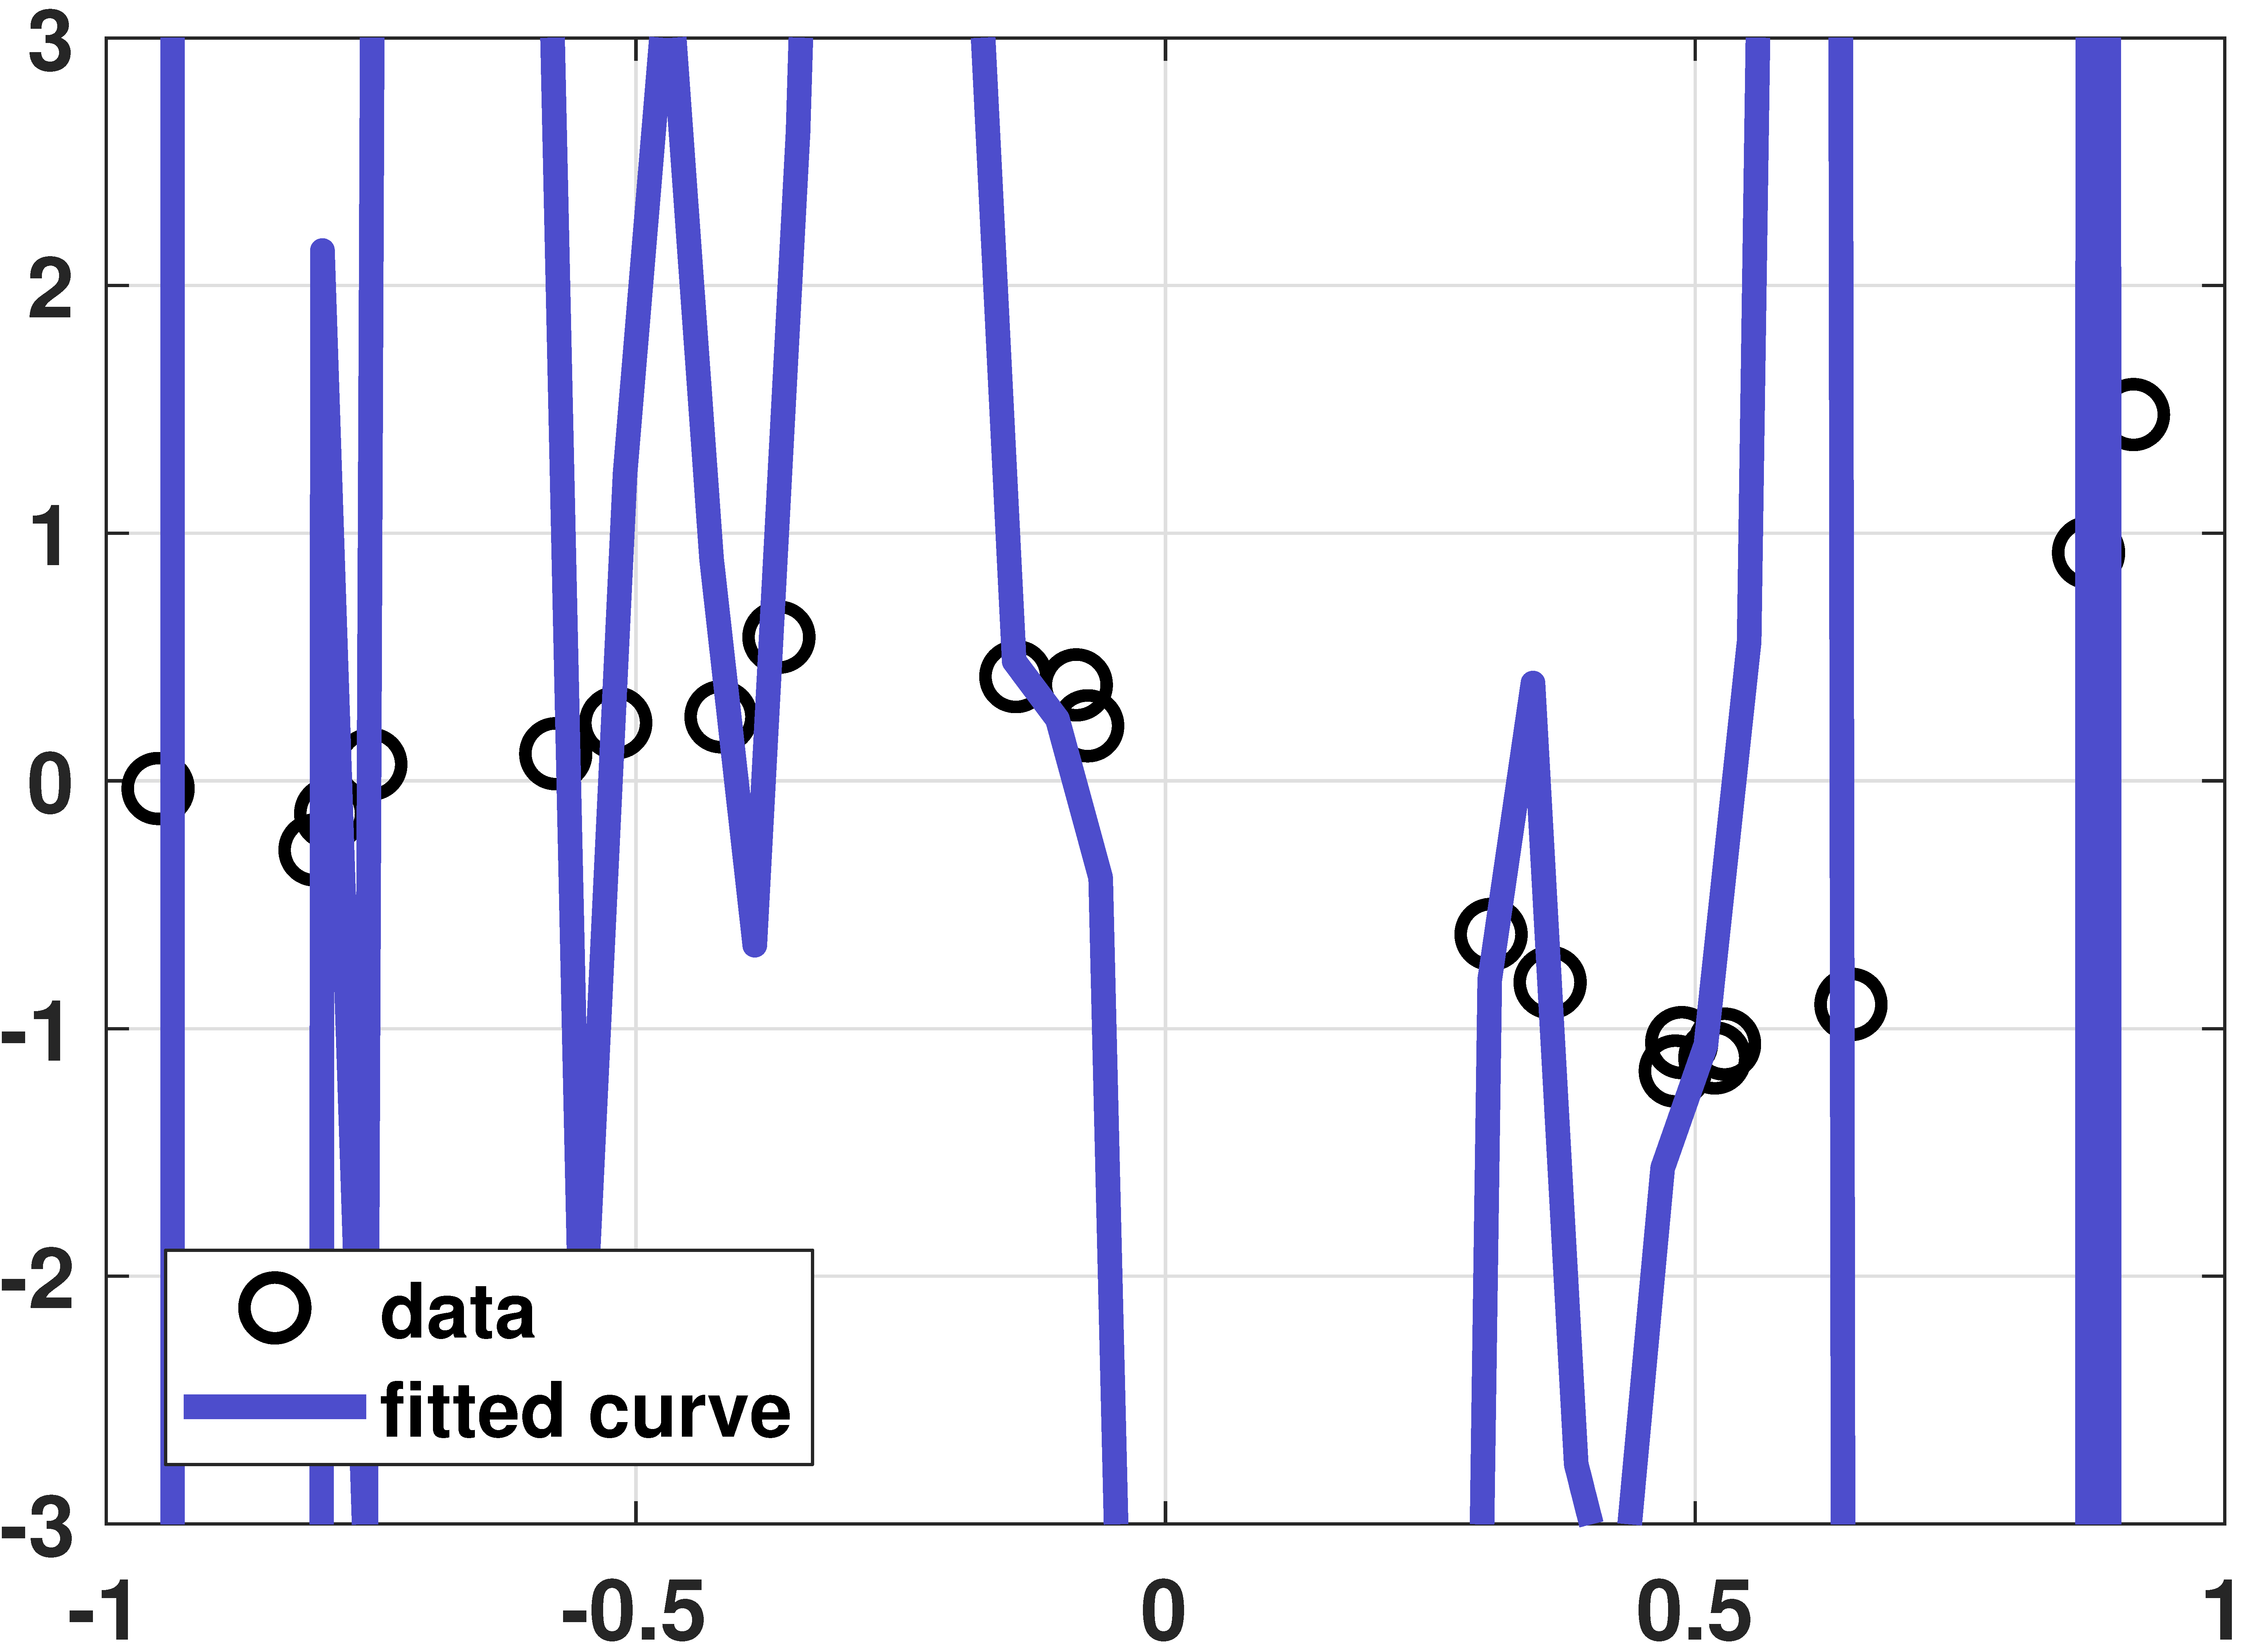
Overfitting example
% MATLAB: An overfitting example
N = 20;
x = sort(1*(rand(N,1)*2-1));
a = [-0.001 0.01 +0.55 1.5 1.2];
y = a(1)*legendreP(0,x) + a(2)*legendreP(1,x) + ...
    a(3)*legendreP(2,x) + a(4)*legendreP(3,x) + ...
    a(5)*legendreP(4,x) + 0.1*randn(N,1);

figure(1);
P = 20;
X = zeros(N, P+1);
for p=0:P
    tmp = legendreP(p,x);
    X(:,p+1) = tmp(:);
end
beta = X\y;

t    = linspace(-1, 1, 50);
Xhat = zeros(length(t), P+1);
for p=0:P
    tmp = legendreP(p,t);
    Xhat(:,p+1) = tmp(:);
end
yhat = Xhat*beta;
plot(x,y,   'ko','LineWidth',2, 'MarkerSize', 10); hold on;
plot(t,yhat,'LineWidth',4,'Color',[0.3 0.3 0.8]);
legend('data', 'fitted curve','Location','SW');
grid on;
set(gcf, 'Position', [100, 100, 600, 400]);
set(gca,'FontWeight','bold','fontsize',14);
axis([-1 1 -3 3]);
# Julia: An overfitting example

using LegendrePolynomials

N = 20
x = sort(rand(N)*2 .- 1)
a = [-0.001, 0.01, 0.55, 1.5, 1.2]
y = hcat([Pl.(x,p) for p=0:4]...)*a + 0.1*randn(N)

P = 20
X = hcat([Pl.(x,p) for p=0:P]...)

beta = X\y

t    = range(-1,stop=1,length=50)
Xhat = hcat([Pl.(t,p) for p=0:P]...)
yhat = Xhat*beta

p6 = scatter(x,y,makershape=:circle,label="data",legend=:bottomleft,ylims = (-3,3))
plot!(t,yhat,linecolor=:blue,linewidth=4,label="fitted curve")
display(p6)
# R: An overfitting example
N = 20
x = sort(rnorm(N)*2-1)
a = c(-0.001, 0.01, 0.55, 1.5, 1.2)
y = a[1]*legendre(0, x) + a[2]*legendre(1, x)[1,] +
  a[3]*legendre(2, x)[1,] + a[4]*legendre(3, x)[1,] +
  a[5]*legendre(4, x)[1,] + 0.1*rnorm(N)

P = 20
X = matrix(0, N, P+1)
for (p in 0:P) {
  tmp = matrix(legendre(p, x))[1,]
  X[,p+1] = tmp
}
beta = mldivide(X, y)

t = linspace(-1, 1, 50)
Xhat = matrix(0, length(t), P+1)
for (p in 0:P) {
  tmp = matrix(legendre(p, t))[1,]
  Xhat[,p+1] = tmp
}
yhat = mldivide(Xhat, beta)
plot(x, y)
lines(t, yhat)
Learning curve
% MATLAB
Nset = round(logspace(1,3,20));
E_train = zeros(1,length(Nset));
E_test  = zeros(1,length(Nset));
a = [1.3, 2.5];
for j = 1:length(Nset)
    N = Nset(j);
    x = linspace(-1,1,N)';
    E_train_temp = zeros(1,1000);
    E_test_temp  = zeros(1,1000);
    X = [ones(N,1), x(:)];
    for i = 1:1000
        y  = a(1) + a(2)*x + randn(size(x));
        y1 = a(1) + a(2)*x + randn(size(x));
        theta = X\y(:);
        yhat = theta(1) + theta(2)*x;
        E_train_temp(i) = mean((yhat(:)-y(:)).^2);
        E_test_temp(i)  = mean((yhat(:)-y1(:)).^2);
    end
    E_train(j) = mean(E_train_temp);
    E_test(j)  = mean(E_test_temp);
end
semilogx(Nset, E_train, 'kx', 'LineWidth', 2, 'MarkerSize', 16); hold on;
semilogx(Nset, E_test, 'ro', 'LineWidth', 2, 'MarkerSize', 8);
semilogx(Nset, 1-2./Nset, 'k', 'LineWidth', 4);
semilogx(Nset, 1+2./Nset, 'r', 'LineWidth', 4);
# Python
import numpy as np
import matplotlib.pyplot as plt

Nset = np.logspace(1,3,20)
Nset = Nset.astype(int)
E_train = np.zeros(len(Nset))
E_test  = np.zeros(len(Nset))
for j in range(len(Nset)):
  N = Nset[j]
  x = np.linspace(-1,1,N)
  a = np.array([1, 2])
  E_train_tmp = np.zeros(1000)
  E_test_tmp  = np.zeros(1000)
  for i in range(1000):
    y              = a[0] + a[1]*x + np.random.randn(N)
    X              = np.column_stack((np.ones(N), x))
    theta          = np.linalg.lstsq(X, y, rcond=None)[0]
    yhat           = theta[0] + theta[1]*x
    E_train_tmp[i] = np.mean((yhat-y)**2)
    y1             = a[0] + a[1]*x + np.random.randn(N)
    E_test_tmp[i]  = np.mean((yhat-y1)**2)
  E_train[j] = np.mean(E_train_tmp)
  E_test[j]  = np.mean(E_test_tmp)
plt.semilogx(Nset, E_train, 'kx')
plt.semilogx(Nset, E_test, 'ro')
plt.semilogx(Nset, (1-2/Nset), linewidth=4, c='k')
plt.semilogx(Nset, (1+2/Nset), linewidth=4, c='r')
# Julia
using Statistics

Nset = round.( Int,exp10.(range(1,stop=3,length=20)) )  #10,13,16,21,...

E_train = zeros(length(Nset))
E_test  = zeros(length(Nset))
a = [1.3, 2.5]
for j = 1:length(Nset)
    local N,x,E_train_temp,E_test_temp,X
    N = Nset[j]
    x = range(-1,stop=1,length=N)
    E_train_temp = zeros(1000)
    E_test_temp  = zeros(1000)
    X = [ones(N) x]
    for i = 1:1000
        local y,y1,theta,yhat
        y  = a[1] .+ a[2]*x + randn(N)
        y1 = a[1] .+ a[2]*x + randn(N)
        theta = X\y
        yhat = theta[1] .+ theta[2]*x
        E_train_temp[i] = mean(abs2,yhat-y)
        E_test_temp[i]  = mean(abs2,yhat-y1)
    end
    E_train[j] = mean(E_train_temp)
    E_test[j]  = mean(E_test_temp)
end

p7 = scatter(Nset,E_train,xscale=:log10,markershape=:x,markercolor=:black,label="Training Error")
scatter!(Nset,E_test,xscale=:log10,markershape=:circle,markercolor=:red,label="Testing Error")
plot!(Nset,1.0 .- 2.0./Nset,xscale=:log10,linestyle=:solid,color=:black,label="")
plot!(Nset,1.0 .+ 2.0./Nset,xscale=:log10,linestyle=:solid,color=:red,label="")
display(p7)
Chapter 7.3 Bias and Variance
Mean estimator
% MATLAB code to visualize the average predictor
N = 20;
a = [5.7, 3.7, -3.6, -2.3, 0.05];
x = linspace(-1,1,N);
yhat = zeros(100,50);
for i=1:100
    X    = [x(:).^0, x(:).^1, x(:).^2, x(:).^3, x(:).^4];
    y    = X*a(:) + 0.5*randn(N,1);
    theta = X\y(:);
    t    = linspace(-1, 1, 50);
    yhat(i,:) = theta(1) + theta(2)*t(:)   + theta(3)*t(:).^2 ...
                         + theta(4)*t(:)^3 + theta(5)*t(:).^4;
end
figure;
plot(t, yhat, 'color', [0.6 0.6 0.6]); hold on;
plot(t, mean(yhat), 'LineWidth', 4, 'color', [0.8 0 0]);
axis([-1 1 -2 2]);
# Python code to visualize the average predictor
import numpy as np
import matplotlib.pyplot as plt
from scipy.special import eval_legendre
np.set_printoptions(precision=2, suppress=True)

N = 20
x = np.linspace(-1,1,N)
a = np.array([0.5, -2, -3, 4, 6])
yhat = np.zeros((50,100))
for i in range(100):
  y = a[0] + a[1]*x    + a[2]*x**2 + \
             a[3]*x**3 + a[4]*x**4 + 0.5*np.random.randn(N)
  X = np.column_stack((np.ones(N), x, x**2, x**3, x**4))

  theta = np.linalg.lstsq(X, y, rcond=None)[0]
  t = np.linspace(-1,1,50)
  Xhat = np.column_stack((np.ones(50), t, t**2, t**3, t**4))
  yhat[:,i] = np.dot(Xhat, theta)
  plt.plot(t, yhat[:,i], c='gray')
plt.plot(t, np.mean(yhat, axis=1), c='r', linewidth=4)
# Julia code to visualize the average predictor

N = 20
a = [5.7, 3.7, -3.6, -2.3, 0.05]
x = range(-1,stop=1,length=N)
X = x.^[0 1 2 3 4]

t    = range(-1,stop=1,length=50)
tMat = t.^[0 1 2 3 4]

yhat = zeros(50,100)                      #50x100 instead of 100x50
for i = 1:100
    local y,theta
    y = X*a + 0.5*randn(N)
    theta = X\y
    yhat[:,i] = tMat*theta
end

p8 = plot(t,yhat,linecolor=:gray,label="")
plot!(t,mean(yhat,dims=2),linecolor=:red,linewidth=4,label="")
display(p8)
# R code to visualize the average predictor
library(pracma)
N = 20
x = linspace(-1,1,N)
a = c(0.5, -2, -3, 4, 6)
yhat = matrix(0,50,100)
plot(NULL, xlim=c(-1,1), ylim=c(-3,3))
for (i in 1:100) {
  y = a[1] + a[2]*x + a[3]*x**2 + a[4]*x**3 + a[5]*x**4 + 0.5*rnorm(N)
  X = cbind(rep(1,N), x, x**2, x**3, x**4)

  theta = lsfit(X, y)$coefficients[2:6]
  t = linspace(-1, 1, 50)
  Xhat = cbind(rep(1, N), t, t**2, t**3, t**4)
  yhat[,i] = Xhat %*% theta
  lines(t, yhat[,i], col="gray")
}
lines(t, rowMeans(yhat), col="red", lwd=5)
Chapter 7.4 Regularization
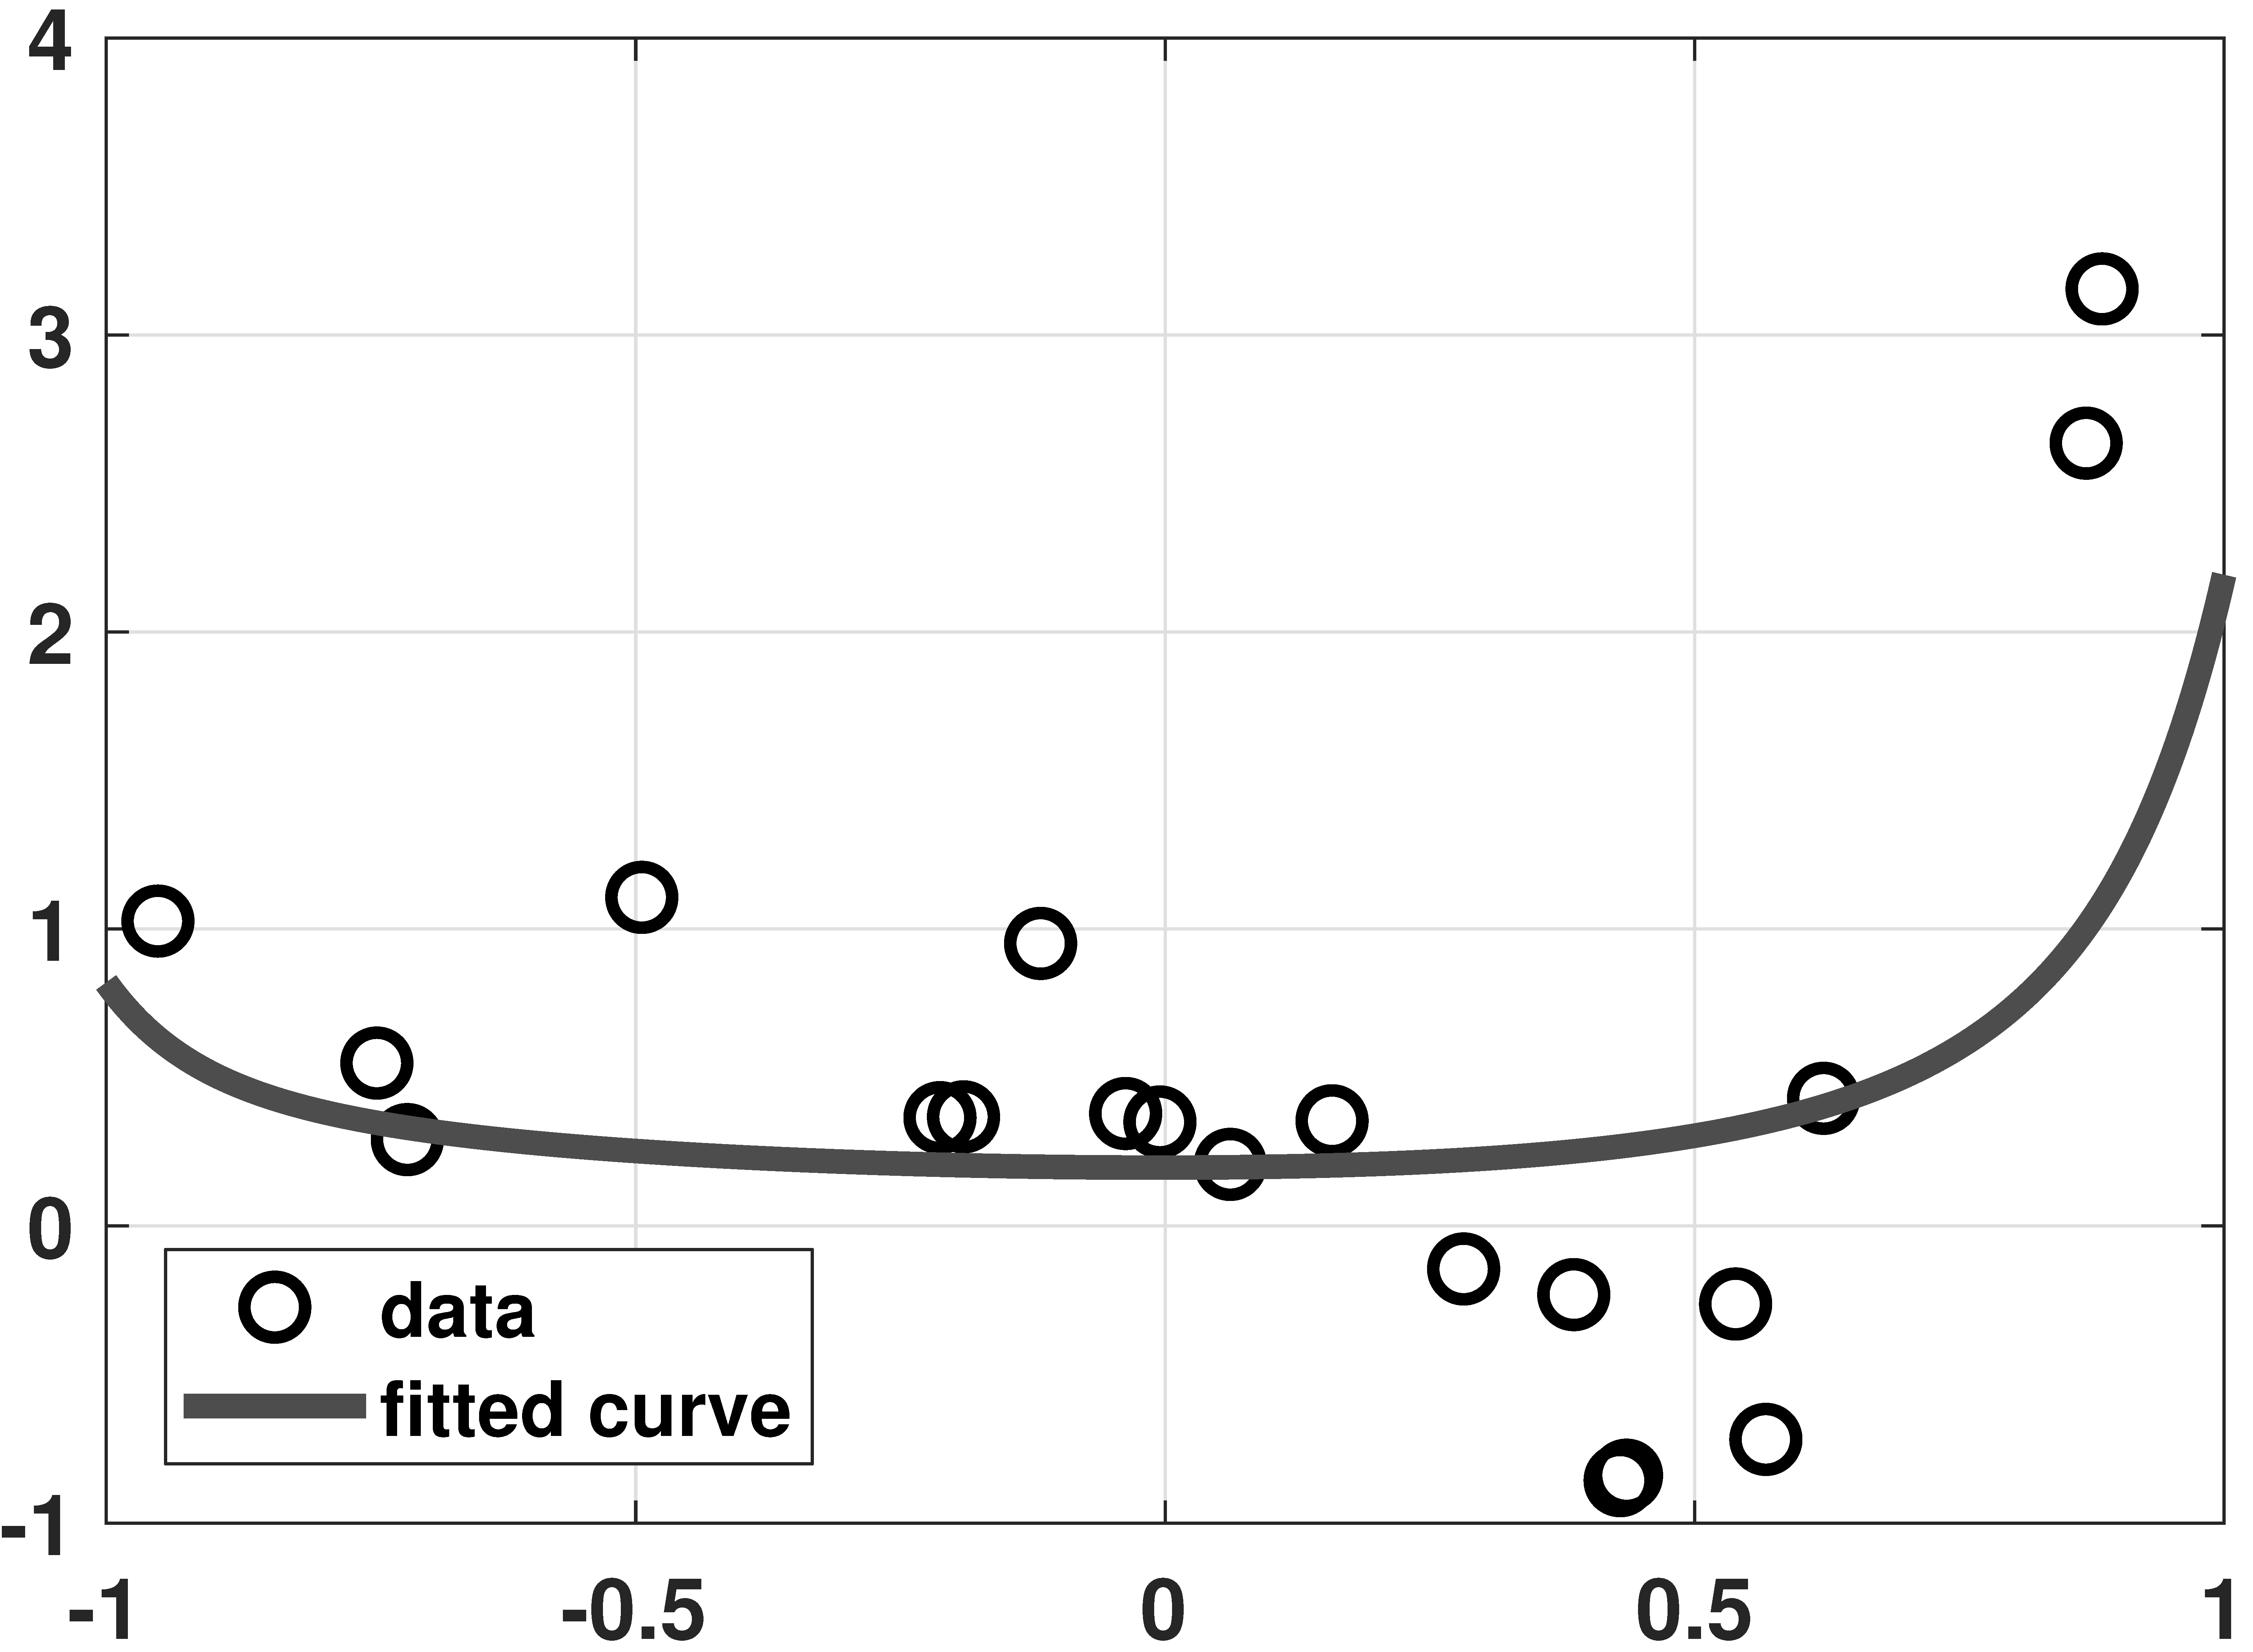
Ridge regression
% MATLAB code to demonstrate a ridge regression example
% Generate data
N = 20;
x = linspace(-1,1,N);
a = [0.5, -2, -3, 4, 6];
y = a(1)+a(2)*x(:)+a(3)*x(:).^2+a(4)*x(:).^3+a(5)*x(:).^4+0.25*randn(N,1);

% Ridge regression
lambda = 0.1;
d = 20;
X = zeros(N, d);
for p=0:d-1
    X(:,p+1) = x(:).^p;
end
A = [X; sqrt(lambda)*eye(d)];
b = [y(:); zeros(d,1)];
theta = A\b;

% Interpolate and display results
t    = linspace(-1, 1, 500);
Xhat = zeros(length(t), d);
for p=0:d-1
    Xhat(:,p+1) = t(:).^p;
end
yhat = Xhat*theta;
plot(x,y,   'ko','LineWidth',2, 'MarkerSize', 10); hold on;
plot(t,yhat,'LineWidth',4,'Color',[0.2 0.2 0.9]);
# Python code to demonstrate a ridge regression example
import numpy as np
import matplotlib.pyplot as plt
from scipy.special import eval_legendre
np.set_printoptions(precision=2, suppress=True)

N = 20
x = np.linspace(-1,1,N)
a = np.array([0.5, -2, -3, 4, 6])
y = a[0] + a[1]*x    + a[2]*x**2 + \
           a[3]*x**3 + a[4]*x**4 + 0.2*np.random.randn(N)

d = 20
X = np.zeros((N, d))
for p in range(d):
  X[:,p] = x**p

lambd = 0.1
A = np.vstack((X, np.sqrt(lambd)*np.eye(d)))
b = np.hstack((y, np.zeros(d)))
theta = np.linalg.lstsq(A, b, rcond=None)[0]

t    = np.linspace(-1, 1, 500)
Xhat = np.zeros((500,d))
for p in range(d):
  Xhat[:,p] = t**p
yhat = np.dot(Xhat, theta)

plt.plot(x,y,'o',markersize=12)
plt.plot(t,yhat, linewidth=4)
plt.show()
#  Julia code to demonstrate a ridge regression example

#----------------------------------------------------------
"""
    RidgeRegression(Y,X,lambda,beta0=0)
Calculate ridge regression estimate with targetr vector beta₀.
"""
function RidgeRegression(Y,X,lambda,beta0=0)
    K = size(X,2)
    isa(beta0,Number) && (beta0=fill(beta0,K))
    b = (X'X+lambda*I)\(X'Y+lambda*beta0)      #same as inv(X'X+lambda*I)*(X'Y+lambda*beta0)
    return b
end
#----------------------------------------------------------

N = 20                                 # Generate data
x = range(-1,stop=1,length=N)
a = [0.5, -2, -3, 4, 6]
y = x.^[0 1 2 3 4]*a + 0.25*randn(N)

lambda = 0.1                                # Ridge regression
d = 20
X = x.^collect(0:d-1)'
A = [X; sqrt(lambda)I]
b = [y; zeros(d)]
theta = A\b
theta_alt = RidgeRegression(y,X,lambda)         # alternative ridge regression
display([theta theta_alt])

t    = range(-1,stop=1,length=500)
Xhat = t.^collect(0:d-1)'
yhat = Xhat*theta

p9 = scatter(x,y,makershape=:circle,label="data",legend=:bottomleft)
plot!(t,yhat,linecolor=:blue,linewidth=4,label="fitted curve")
display(p9)
# R code to demonstrate a ridge regression example
N = 20
x = linspace(-1,1,N)
a = c(0.5, -2, -3, 4, 6)
y = a[1] + a[2]*x + a[3]*x**2 + a[4]*x**3 + a[5]*x**4 + 0.2*rnorm(N)

d = 20
X = matrix(0, N, d)
for (p in 1:d) {
  X[,p] = x**p
}
lambd = 0.1
A = rbind(X, (lambd)*diag(d)**(1/2))
b = c(y, rep(0, d))
theta = lsfit(A, b)$coefficients[2:21]

t = linspace(-1, 1, 500)
Xhat = matrix(0, 500,d)
for (p in 1:d) {
  Xhat[,p] = t**p
}
yhat = Xhat %*% theta
plot(x, y)
grid()
lines(t, yhat, col="darkgray", lwd=4)
legend("bottomleft", c("Data", "Fitted curve"), pch=c(1, NA), lty=c(NA, 1))
LASSO regression
Data download: ch7_data_crime.txt (1KB)
% MATLAB
data = load('./dataset/ch7_data_crime.txt');
y    = data(:,1);        % The observed crime rate
X    = data(:,3:end);    % Feature vectors
[N,d]= size(X);

lambdaset = logspace(-1,8,50);
theta_store   = zeros(d,50);
for i=1:length(lambdaset)
    lambda = lambdaset(i);
    cvx_begin
        variable theta(d)
        minimize( sum_square(X*theta-y) + lambda*norm(theta,1) )
%       minimize( sum_square(X*theta-y) + lambda*sum_square(theta) )
    cvx_end
    theta_store(:,i) = theta(:);
end

figure(1);
semilogx(lambdaset, theta_store, 'LineWidth', 4);
legend('funding','% high', '% no high', '% college', ...
        '% graduate', 'Location','NW');
xlabel('lambda');
ylabel('feature attribute');
# Python

import cvxpy as cvx
import numpy as np
import matplotlib.pyplot as plt

data = np.loadtxt("/content/ch7_data_crime.txt")
y = data[:,0]
X = data[:,2:7]
N,d = X.shape

lambd_set = np.logspace(-1,8,50)
theta_store = np.zeros((d,50))
for i in range(50):
  lambd = lambd_set[i]
  theta = cvx.Variable(d)
  objective   = cvx.Minimize( cvx.sum_squares(X*theta-y) \
                + lambd*cvx.norm1(theta) )
# objective   = cvx.Minimize( cvx.sum_squares(X*theta-y) \
                + lambd*cvx.sum_squares(theta) )
  prob        = cvx.Problem(objective)
  prob.solve()
  theta_store[:,i] = theta.value

for i in range(d):
  plt.semilogx(lambd_set, theta_store[i,:])
# Julia
"""
    LassoEN(Y,X,lambda,δ,beta₀)
Do Lasso (set lambda>0,δ=0), ridge (set lambda=0,δ>0) or elastic net regression (set lambda>0,δ>0).
Setting beta₀ allows us to specify the target level.
"""
function LassoEN(Y,X,lambda,δ=0.0,beta₀=0)

    K = size(X,2)
    isa(beta₀,Number) && (beta₀=fill(beta₀,K))

    #b_ls = X\Y                    #LS estimate of weights, no restrictions

    Q  = X'X
    c  = X'Y                      #c'b = Y'X*b

    b  = Variable(K)              #define variables to optimize over
    L1 = quadform(b,Q)            #b'Q*b
    L2 = dot(c,b)                 #c'b
    L3 = norm(b-beta₀,1)             #sum(|b-beta₀|)
    L4 = sumsquares(b-beta₀)         #sum((b-beta₀)^2)

    Sol = minimize(L1-2*L2+lambda*L3+δ*L4)      #u'u + lambda*sum(|b|) + δ*sum(b^2), where u = Y-Xb
    solve!(Sol,()->SCS.Optimizer(verbose = false))
    b_i = vec(evaluate(b))

    return b_i

end
#----------------------------------------------------------

using LinearAlgebra, DelimitedFiles, Convex, SCS
import MathOptInterface
const MOI = MathOptInterface

data  = readdlm("dataset/ch7_data_crime.txt")
y     = data[:,1]        # the observed crime rate
X     = data[:,3:end]    # feature vectors
(N,d) = size(X)

(y,X) = (y.-mean(y),X.-mean(X,dims=1))           # de-meaning all variables

lambdaset = exp10.(range(-2,stop=4,length=50))        # adjusted range of lambda values since X/100 is used
(theta_store,theta_store2,theta_store3) = [zeros(50,d) for _=1:3]   # 50 x d instead of d x 50
for i = 1:length(lambdaset)
    theta_store[i,:]  = LassoEN(y/100,X/100,lambdaset[i])    # LASSO, /100 improves the numerical stability
    theta_store2[i,:] = LassoEN(y/100,X/100,0,lambdaset[i])  # ridge regression
    #theta_store3[i,:] = RidgeRegression(y/100,X/100,lambdaset[i])   # alternative ridge regression
end
#display(theta_store2-theta_store3)                                 # compare solutions

p10 = plot(lambdaset,theta_store,xscale=:log10,title="LASSO",xlabel="lambda",ylabel="feature attribute",
           label = ["funding" "% high" "% no high" "% college" "% graduate"],
            linecolor = [:blue :red :yellow3 :magenta :green],ylims=(-5,15))
display(p10)

p10b = plot(lambdaset,theta_store2,xscale=:log10,title="ridge regression",xlabel="lambda",ylabel="feature attribute",
           label = ["funding" "% high" "% no high" "% college" "% graduate"],
            linecolor = [:blue :red :yellow3 :magenta :green],ylims=(-5,15))
display(p10b)
# R
library(pracma)
library(CVXR)

data = scan("ch7_data_crime.txt")
data = matrix(data, nrow=7)
data = t(data)
y = data[,1]
X = data[,3:8]
N = dim(X)[0]
d = dim(X)[1]

lambd_set = logspace(-1,8,50)
theta_store = matrix(0, d,50)
for (i in 1:50) {
  lambd = lambd_set[i]
  theta = Variable(d)
  lambd = lambd_set[i]
  objective = Minimize(sum_squares(X %*% theta-y)
                         + lambd*norm1(theta))
  # objective   = cvx.Minimize( cvx.sum_squares(X*theta-y) \
  prob = Problem(objective)
  result = solve(prob)
  theta_store[,i] = result$getValue(theta)
}
plot(NULL, xlim=c(10**(-2), 10**8), ylim=c(-2,14))
for (i in 1:d) {
  lines(log(lambd_set), theta_store[i,])
}
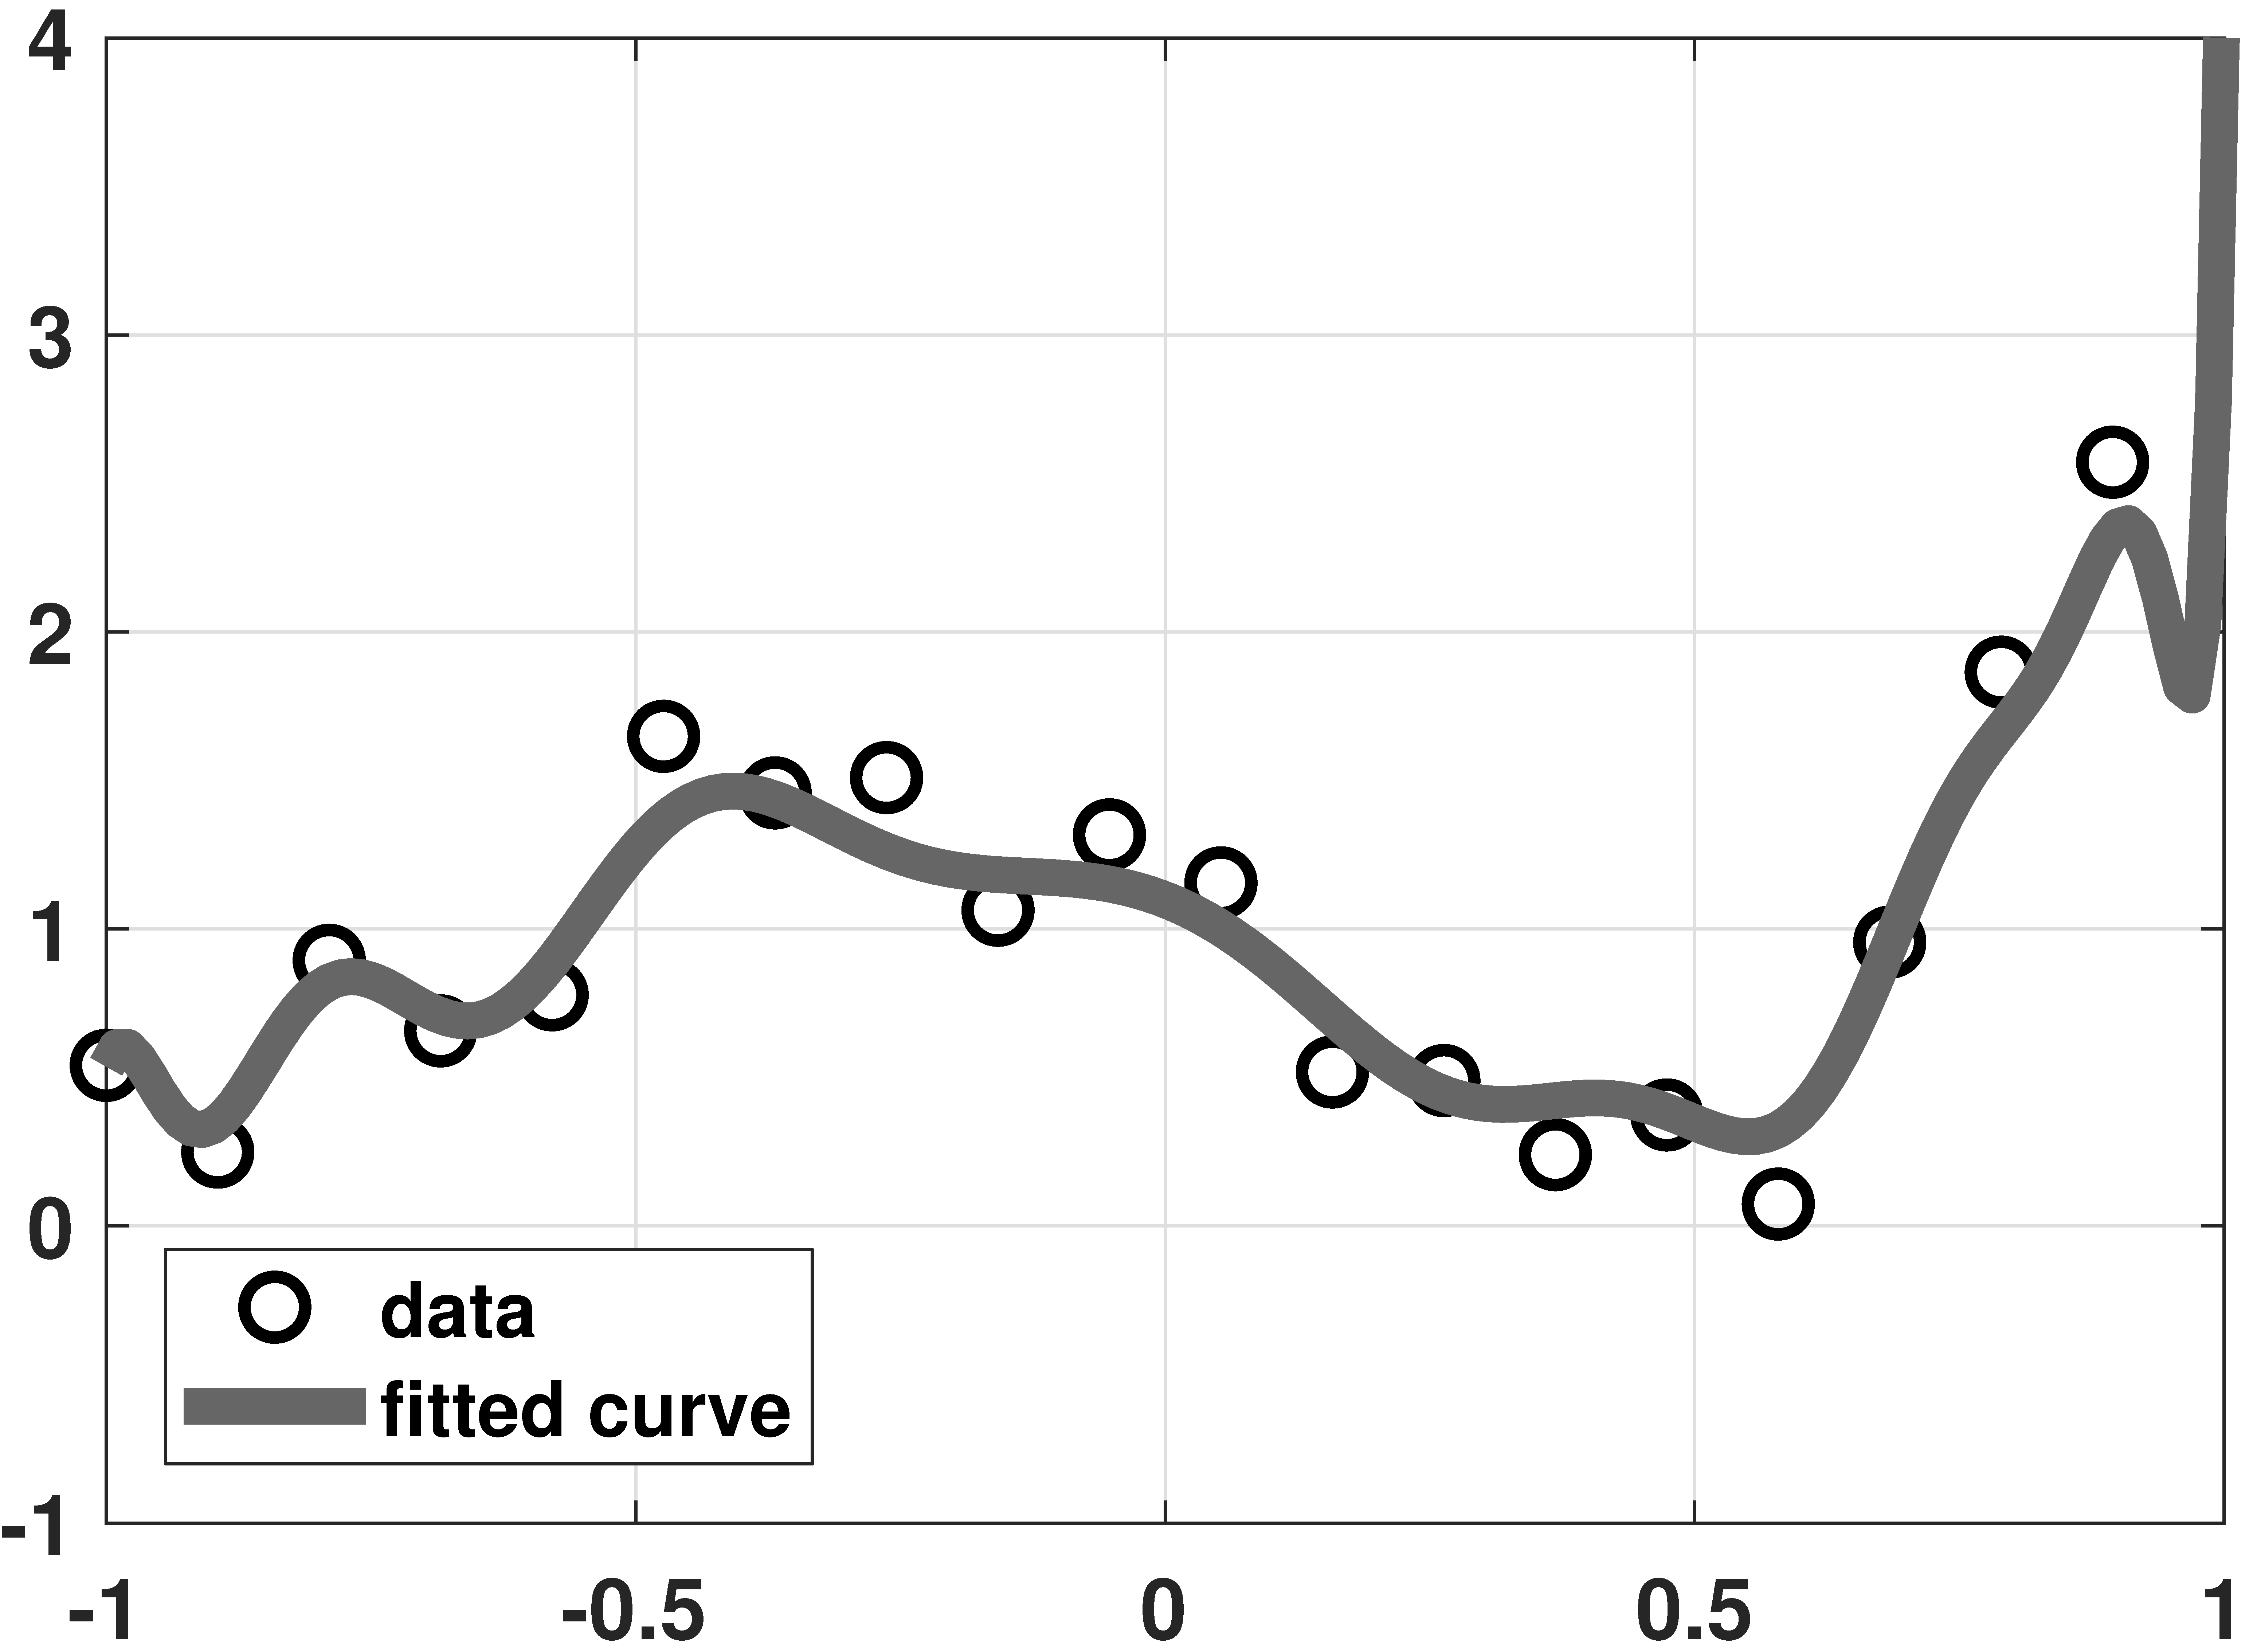
LASSO vs Ridge
% MATLAB code to demonstrate overfitting and LASSO
% Generate data
N = 20;
x = linspace(-1,1,N)';
a = [1, 0.5, 0.5, 1.5, 1];
y = a(1)*legendreP(0,x)+a(2)*legendreP(1,x)+a(3)*legendreP(2,x)+ ...
    a(4)*legendreP(3,x)+a(5)*legendreP(4,x)+0.25*randn(N,1);

% Solve LASSO using CVX
d = 20;
X = zeros(N, d);
for p=0:d-1
    X(:,p+1) = reshape(legendreP(p,x),N,1);
end
lambda = 2;
cvx_begin
    variable theta(d)
    minimize( sum_square( X*theta - y ) + lambda * norm(theta , 1) )
cvx_end

% Plot results
t    = linspace(-1, 1, 200);
Xhat = zeros(length(t), d);
for p=0:d-1
    Xhat(:,p+1) = reshape(legendreP(p,t),200,1);
end
yhat = Xhat*theta;
plot(x,y,   'ko','LineWidth',2, 'MarkerSize', 10); hold on;
plot(t,yhat,'LineWidth',6,'Color',[0.2 0.5 0.2]);
# Python code to demonstrate overfitting and LASSO
import cvxpy as cvx
import numpy as np
import matplotlib.pyplot as plt

# Setup the problem
N = 20
x = np.linspace(-1,1,N)
a = np.array([1, 0.5, 0.5, 1.5, 1])
y = a[0]*eval_legendre(0,x) + a[1]*eval_legendre(1,x) + \
    a[2]*eval_legendre(2,x) + a[3]*eval_legendre(3,x) + \
    a[4]*eval_legendre(4,x) + 0.25*np.random.randn(N)

# Solve LASSO using CVX
d = 20
lambd = 1
X = np.zeros((N, d))
for p in range(d):
  X[:,p] = eval_legendre(p,x)

theta       = cvx.Variable(d)
objective   = cvx.Minimize( cvx.sum_squares(X*theta-y) \
                            + lambd*cvx.norm1(theta) )
prob        = cvx.Problem(objective)
prob.solve()
thetahat = theta.value

# Plot the curves
t = np.linspace(-1, 1, 500)
Xhat = np.zeros((500,d))
for p in range(P):
  Xhat[:,p] = eval_legendre(p,t)
yhat = np.dot(Xhat, thetahat)
plt.plot(x, y, 'o')
plt.plot(t, yhat, linewidth=4)
# Julia code to demonstrate overfitting and LASSO

using LinearAlgebra, LegendrePolynomials, Convex, SCS
import MathOptInterface
const MOI = MathOptInterface

N = 20                                          # Generate data
x = range(-1,stop=1,length=N)
a = [1, 0.5, 0.5, 1.5, 1]
y = hcat([Pl.(x,p) for p=0:4]...)*a + 0.25*randn(N)

d = 20                                          # Solve LASSO using Convex.jl
X = hcat([Pl.(x,p) for p=0:d-1]...)
lambda = 2
theta = LassoEN(y,X,lambda)

t    = range(-1,stop=1,length=200)
Xhat = hcat([Pl.(t,p) for p=0:d-1]...)
yhat = Xhat*theta

p11 = scatter(x,y,makershape=:circle,label="data",legend=:bottomleft)
plot!(t,yhat,linecolor=:blue,linewidth=4,label="fitted curve")
display(p11)
# R code to demonstrate overfitting and LASSO

# Setup the problem

install.packages("CVXR")
library(pracma)
library(CVXR)

N = 20
x = linspace(-1,1,N)
a = c(1, 0.5, 0.5, 1.5, 1)
y = a[1]*legendre(0,x) + a[2]*legendre(1,x)[1,] +
  a[3]*legendre(2,x)[1,] + a[4]*legendre(3,x)[1,] +
  a[5]*legendre(4,x)[1,] + 0.25*rnorm(N)

# Solve LASSO using CVX
d = 20
lambd = 1
X = matrix(0, N, d)
for (p in 1:d) {
  X[,p] = legendre(p,x)[1,]
}
theta = Variable(d)
objective = Minimize(sum_squares(X %*% theta-y)
                      + lambd*norm1(theta))
prob = Problem(objective)
result = solve(prob)
thetahat = result$getValue(theta)

# Plot the curves
t = linspace(-1, 1, 500)
Xhat = matrix(0, 500, d)
for (p in 1:P) {
  Xhat[,p] = legendre(p,t)[1,]
}
yhat = Xhat %*% thetahat
plot(x, y)
lines(t, yhat)

